
We know, our country is often subject to intense flood phenomena which almost always generate victims and extensive damage. Taking into consideration the data reported by Wikipedia on floods and inundations in Italy, truly impressive numbers emerge. For example, in the last 10 years the most destructive are the 18 deaths of the flood in Sardinia of November 2013 or the 13 of the flood in Liguria of October 2011. Going even further Back in time we find the flood in Piedmont in 2000 with 23 deaths and 40,000 displaced people, the flood in Campania in 1998 with 160 victims. On the causes triggering these phenomena, I refer you to this in-depth video by Geopop.
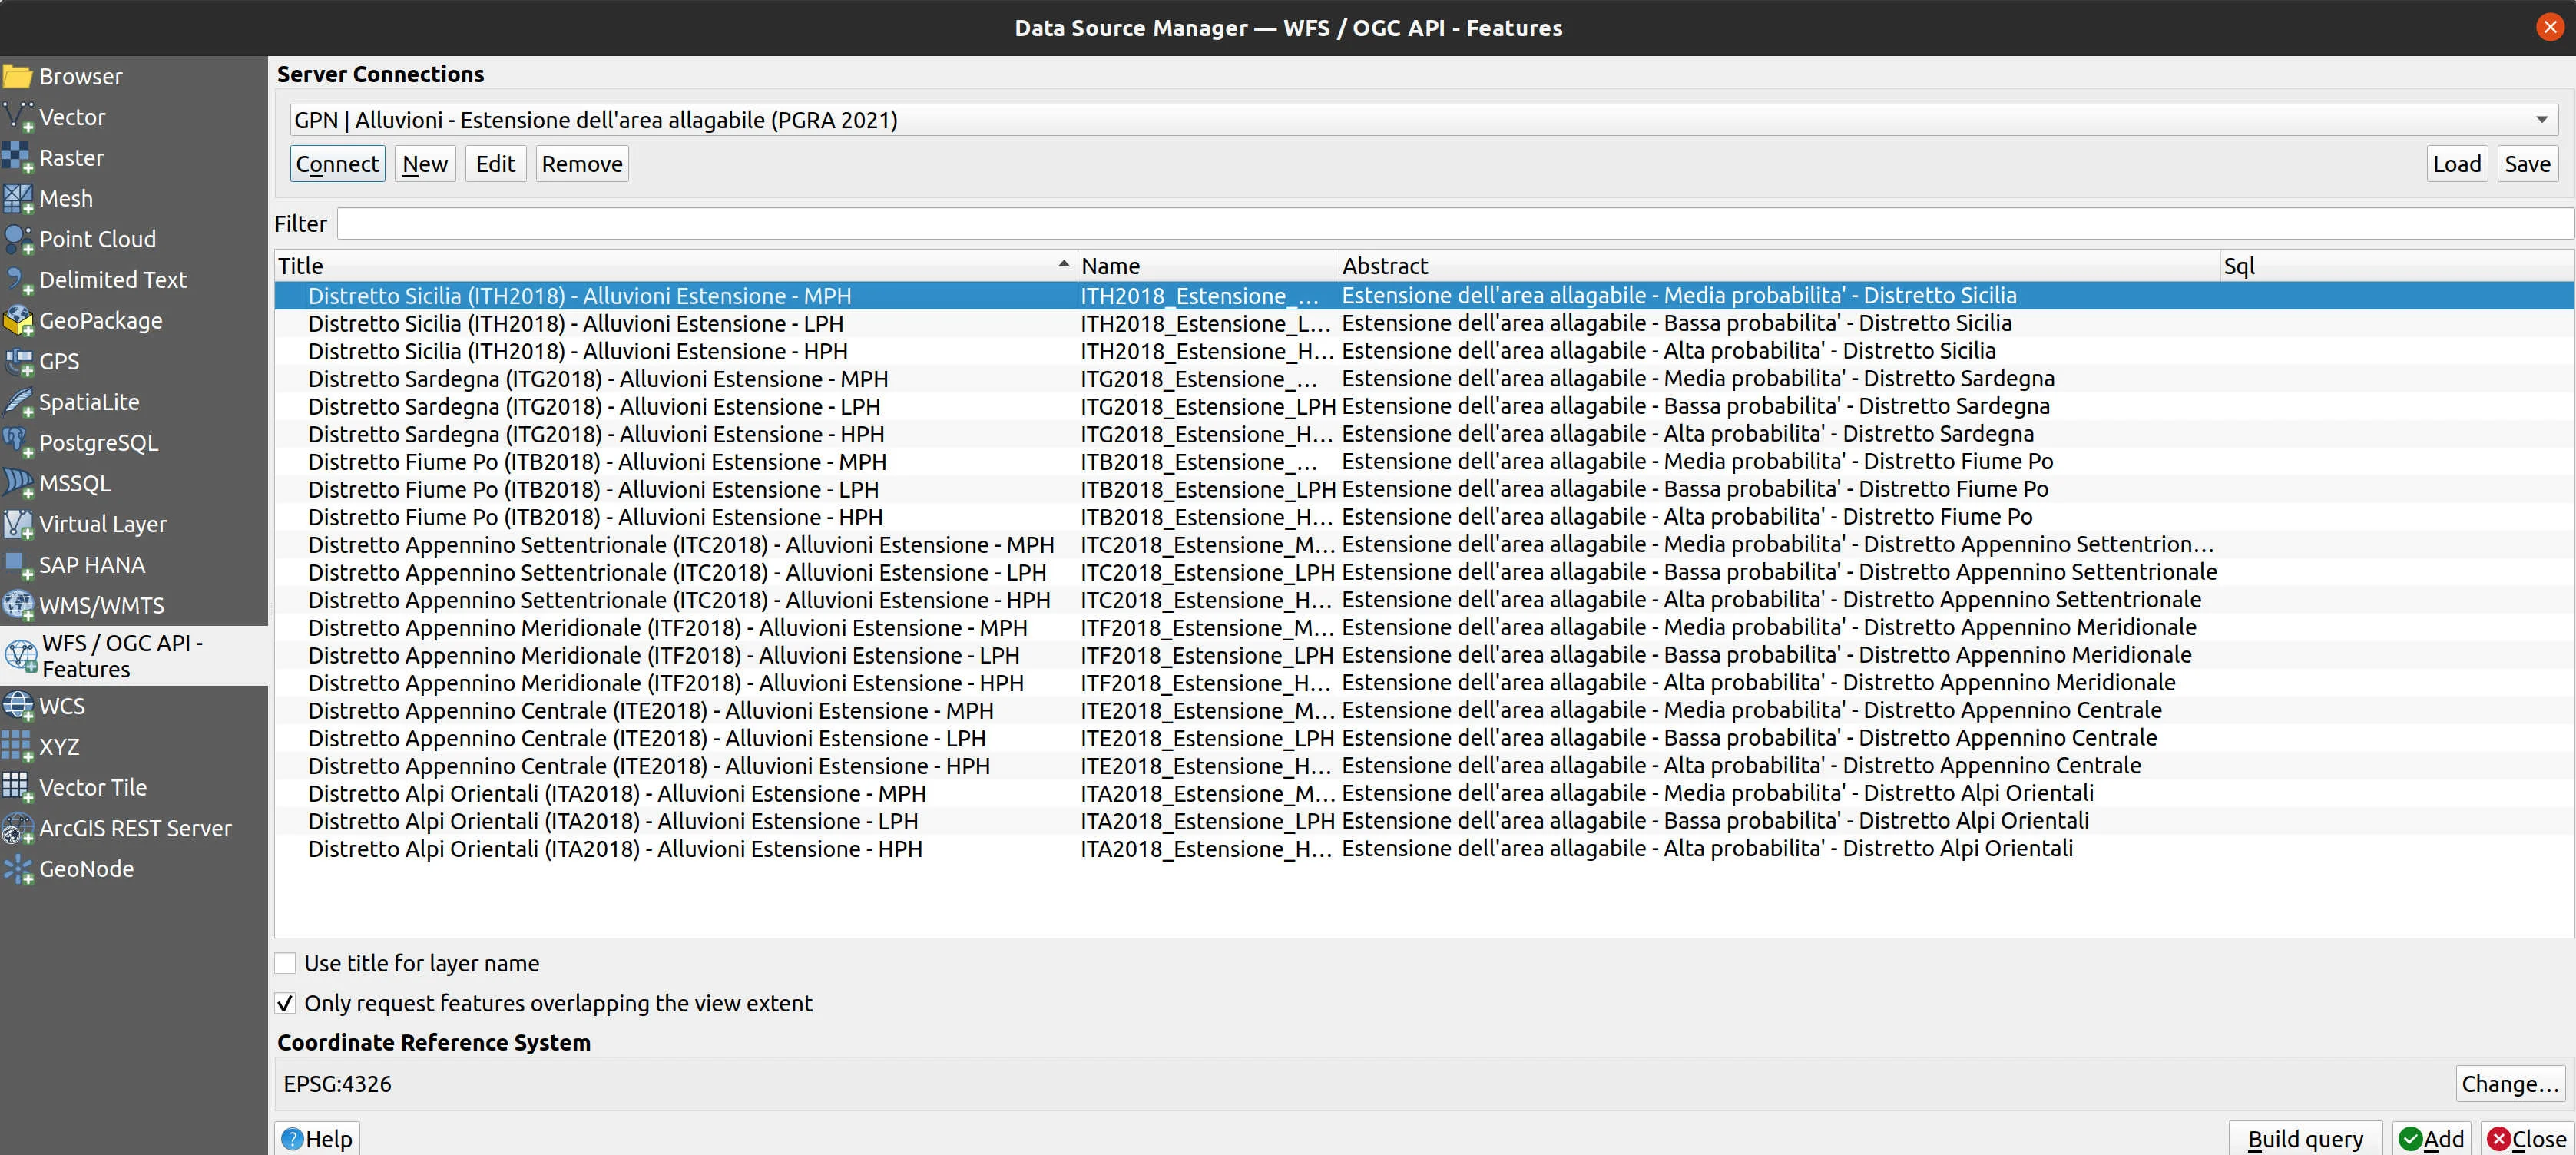
A few days ago, consulting the data from the WFS service of the National Geoportal, I came across the "Floods - Extension of the floodable area (PGRA 2021)" layer which reports the cataloging of the geographical areas that could be affected from the flooding of a watercourse according to three probability bands:
- low probability of floods or extreme event scenarios - LPH;
- average probability of floods - MPH;
- high probability of floods - HPH;
"The Directive outlines a path for the drafting of the Plans, defined by a series of implementation stages, characterized by specific obligations and deadlines, within a management cycle with a periodicity of 6 years. The Directive also provides that within 3 months of the deadlines established for each stage of implementation, a series of information is reported to the European Commission, according to well-defined methods and formats.
The flood risk management plans have been prepared by the authorities of catchment areas of the 5 river basin districts in which it is the national territory is divided (Po river, Eastern Alps, Northern Apennines, Central Apennines, Southern Apennines) as well as from the regions of Sardinia and Sicily. The periodic review and possible updating of the Plans every 6 years allows flood risk management to be adapted to the changed conditions of the area, also taking into account the probable impact of climate change on the occurrence of floods."
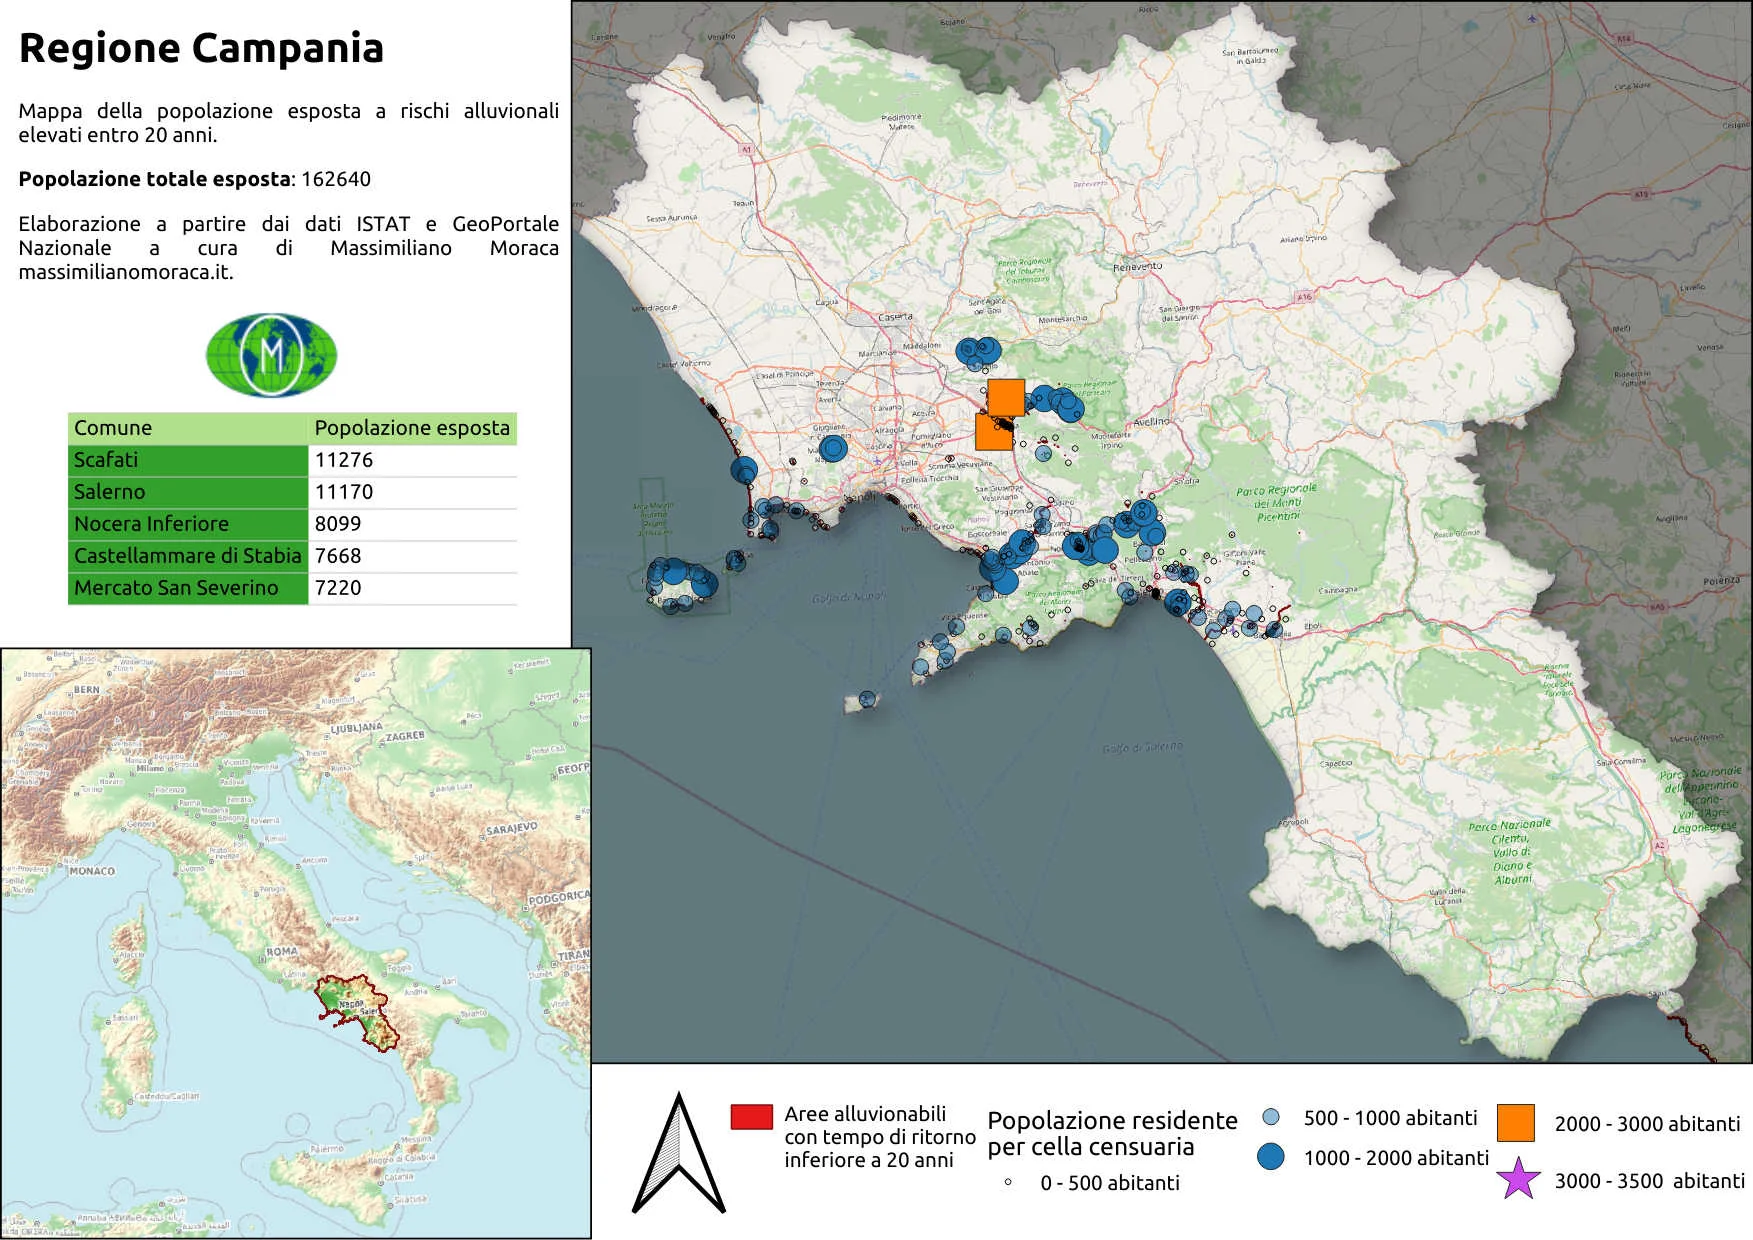
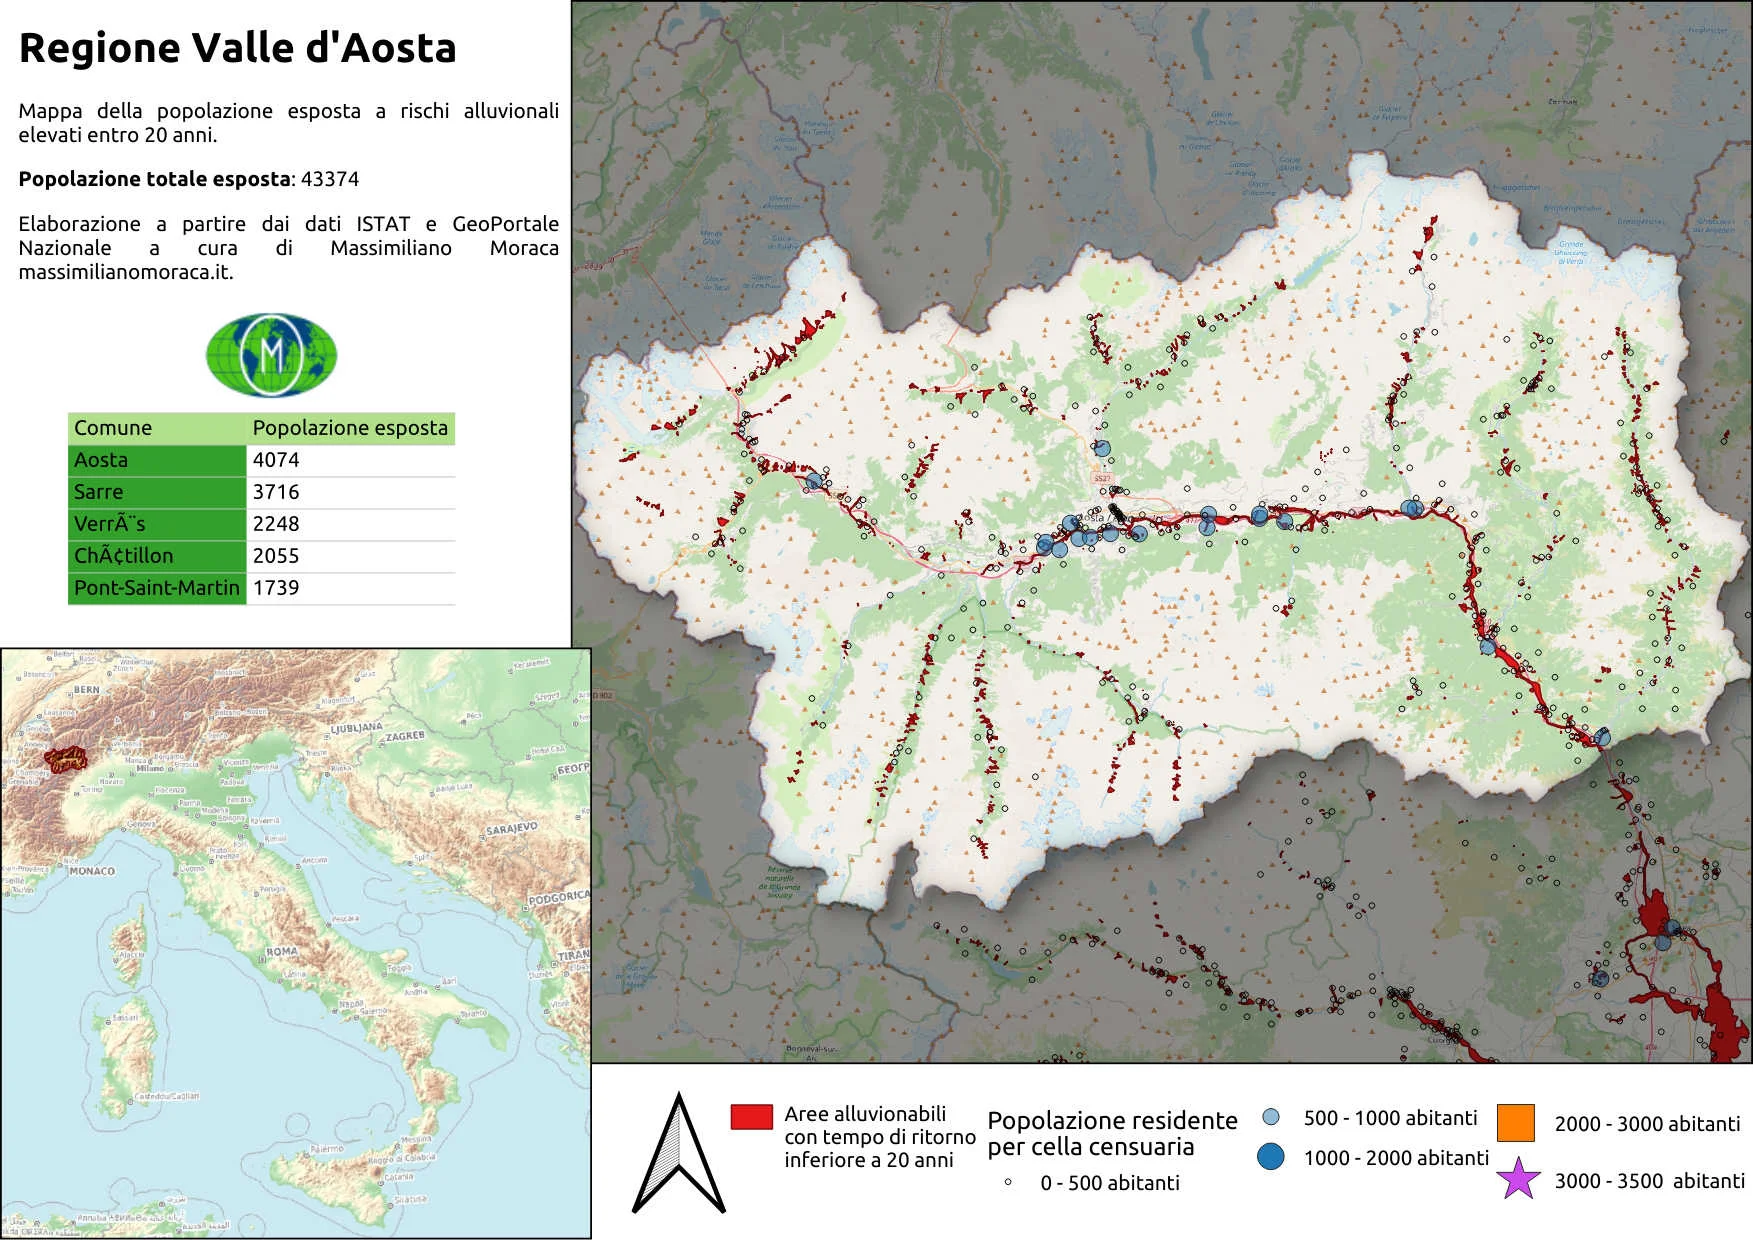
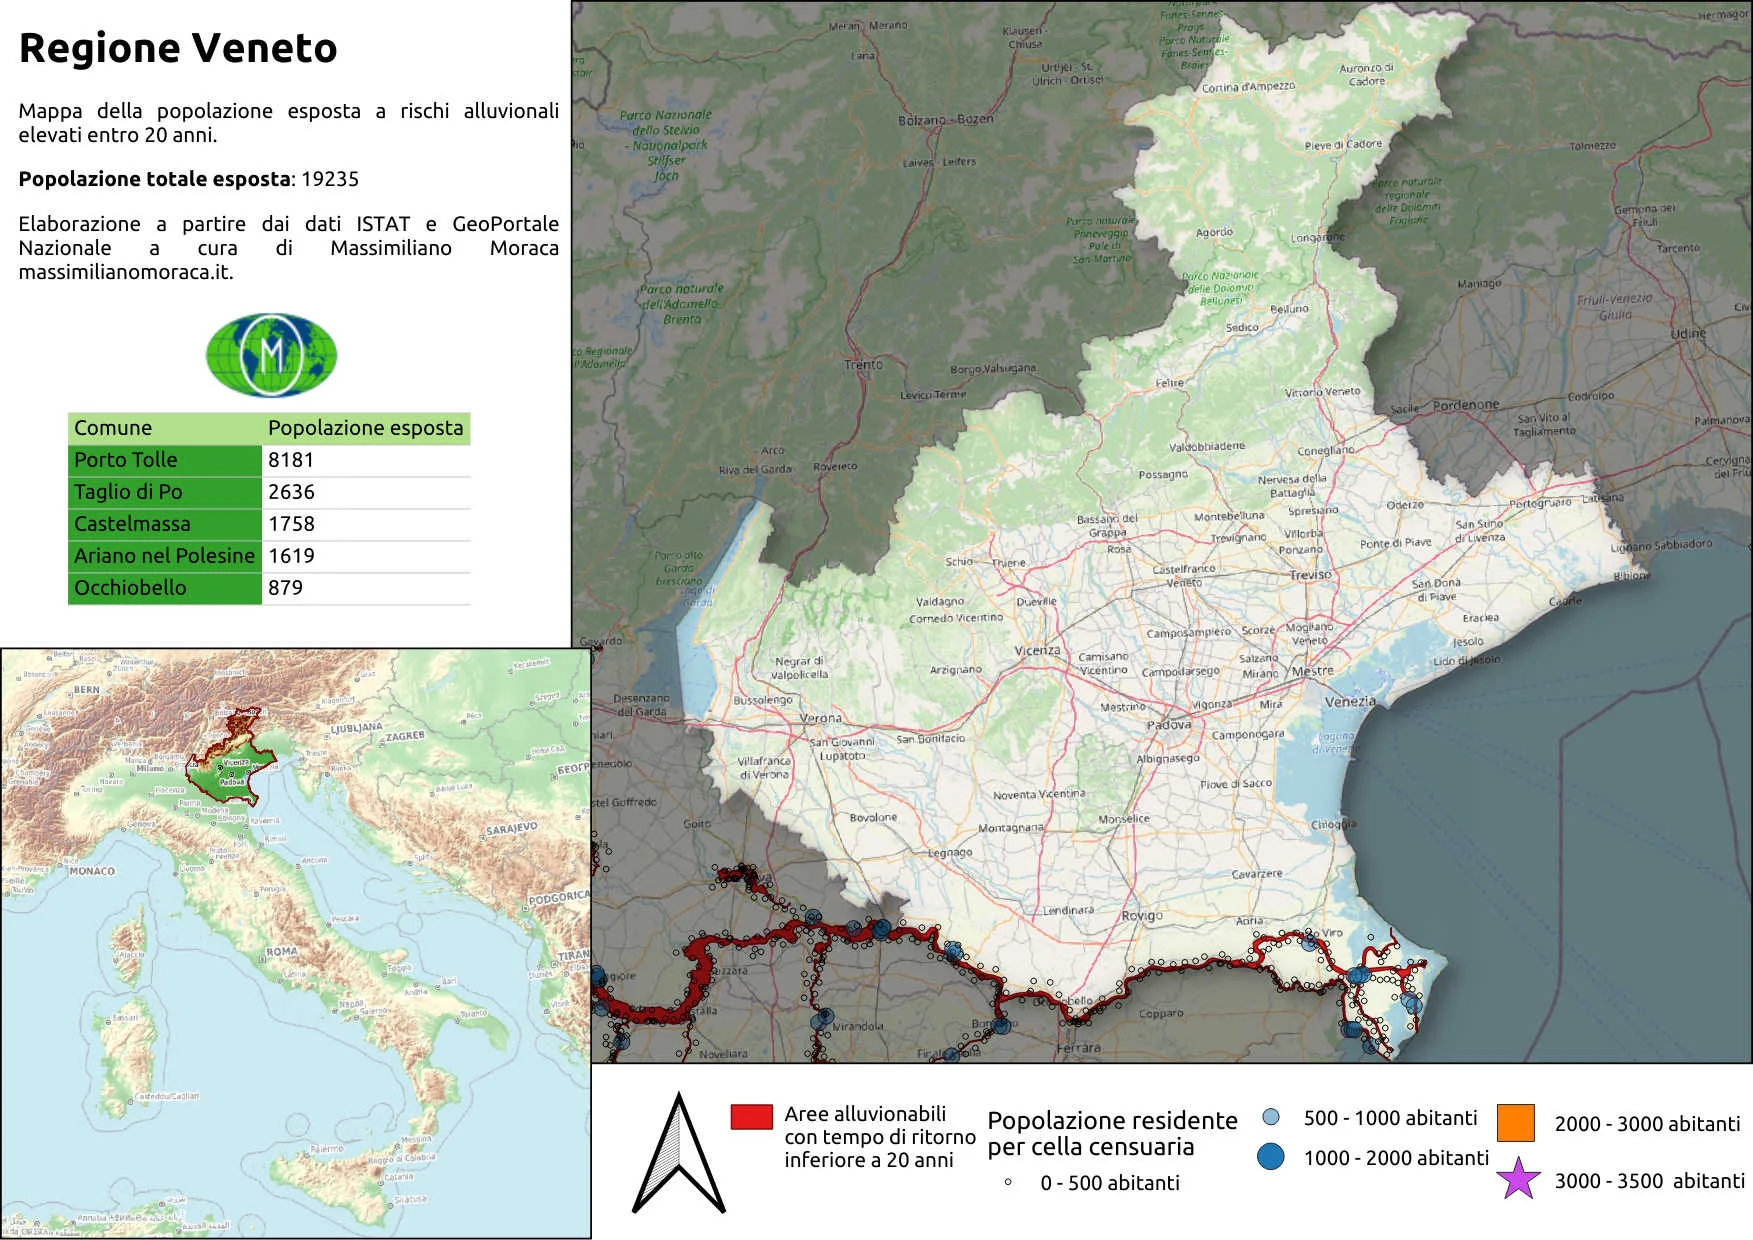
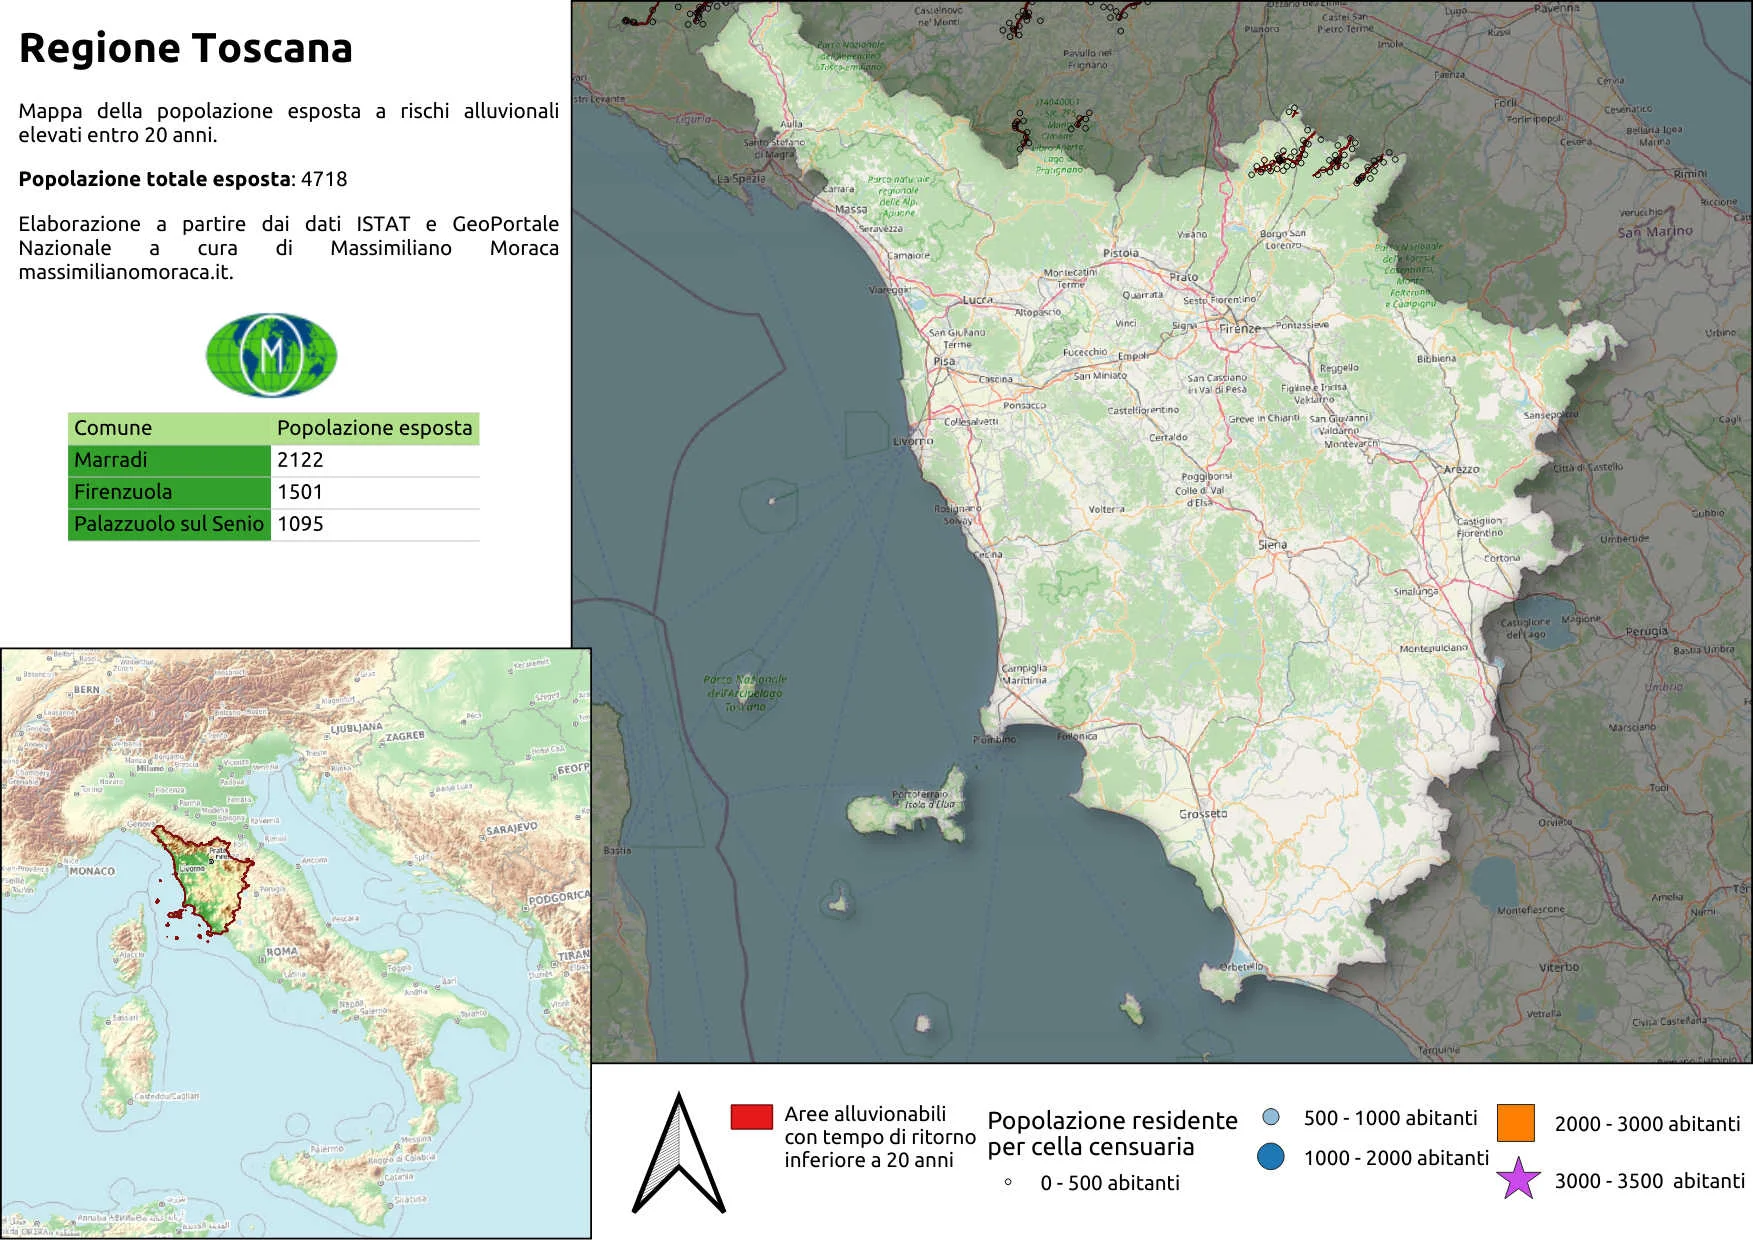
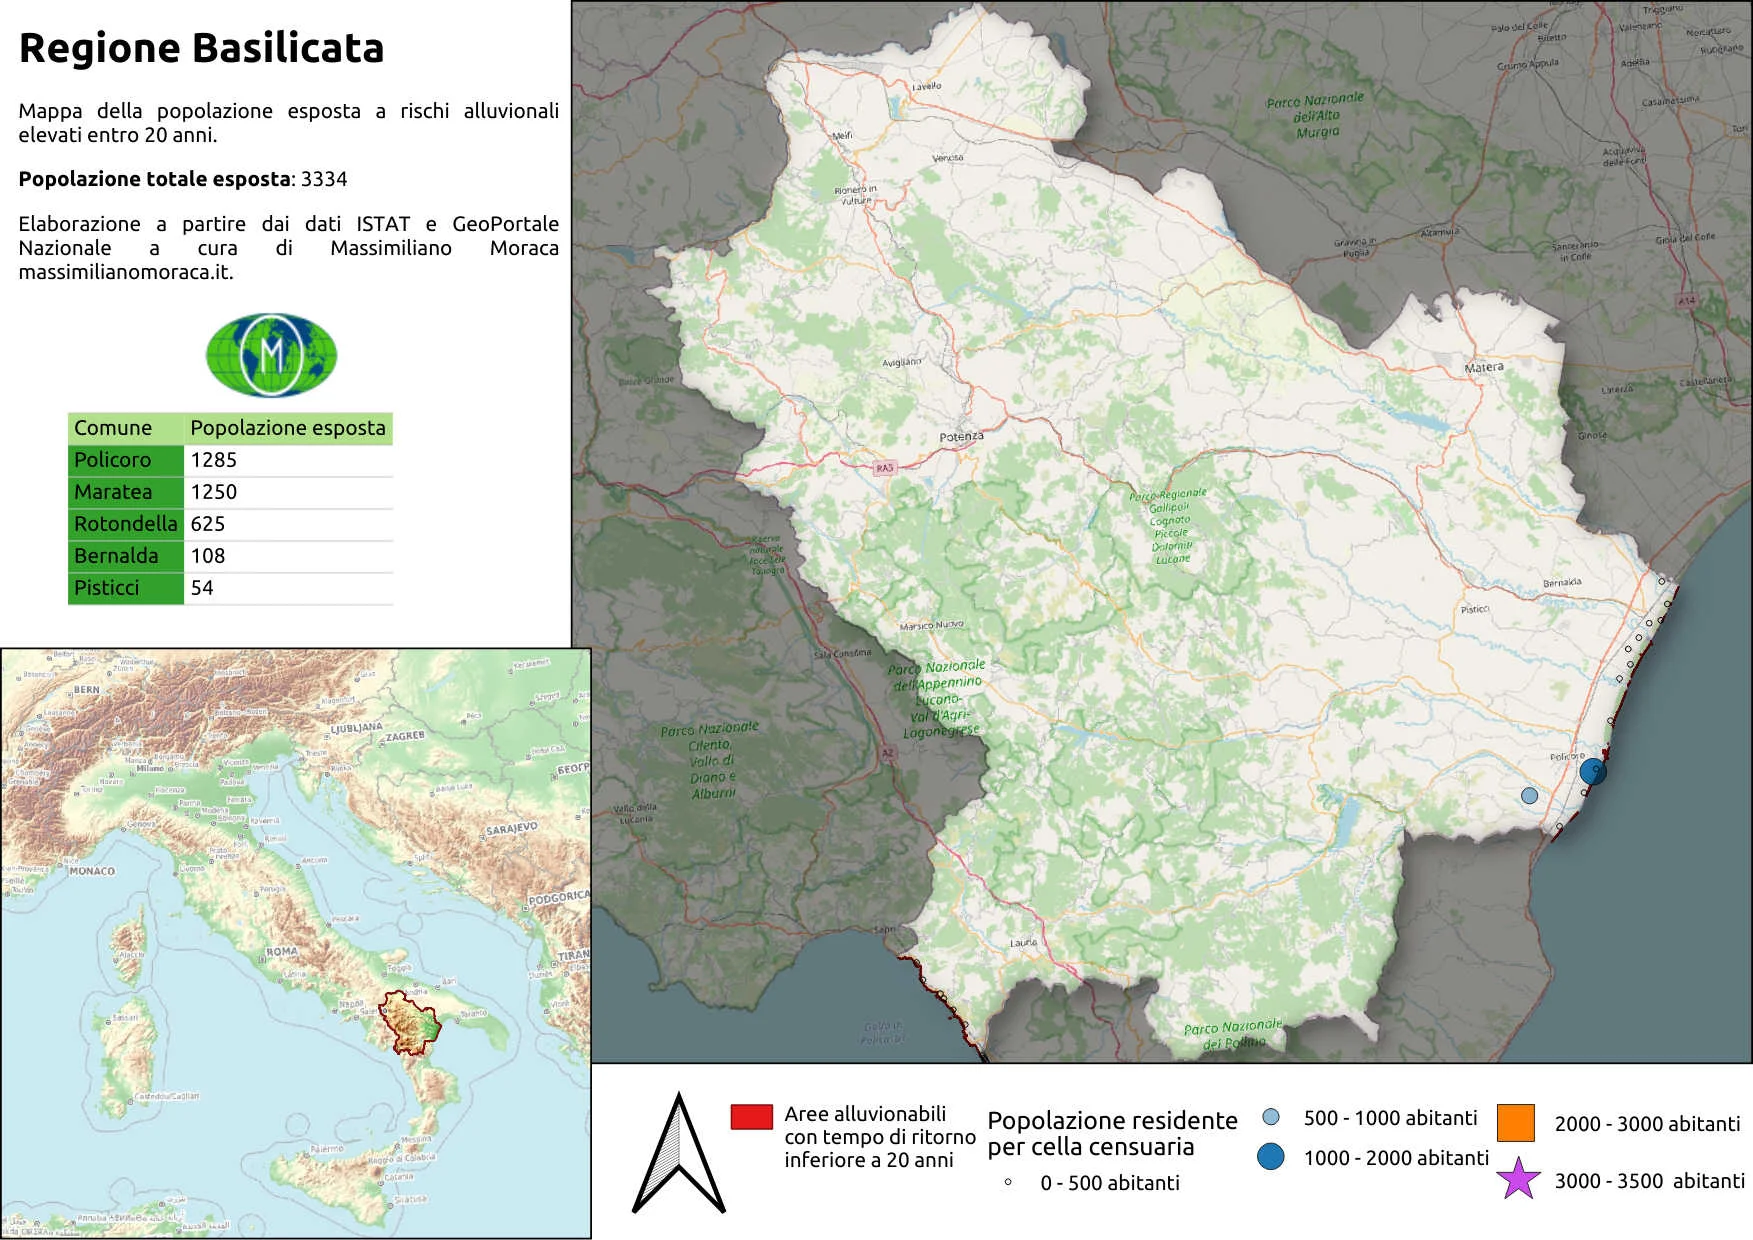
I only focused on areas with high probability of floods and with a return time of less than 20 years and using Python and QGIS I intersected these data with those of the latest ISTAT census (2011 at the time of writing this article). On why I used Python to do a simple filter operation and a selection operation. I'll talk about it. soon in a specific article.
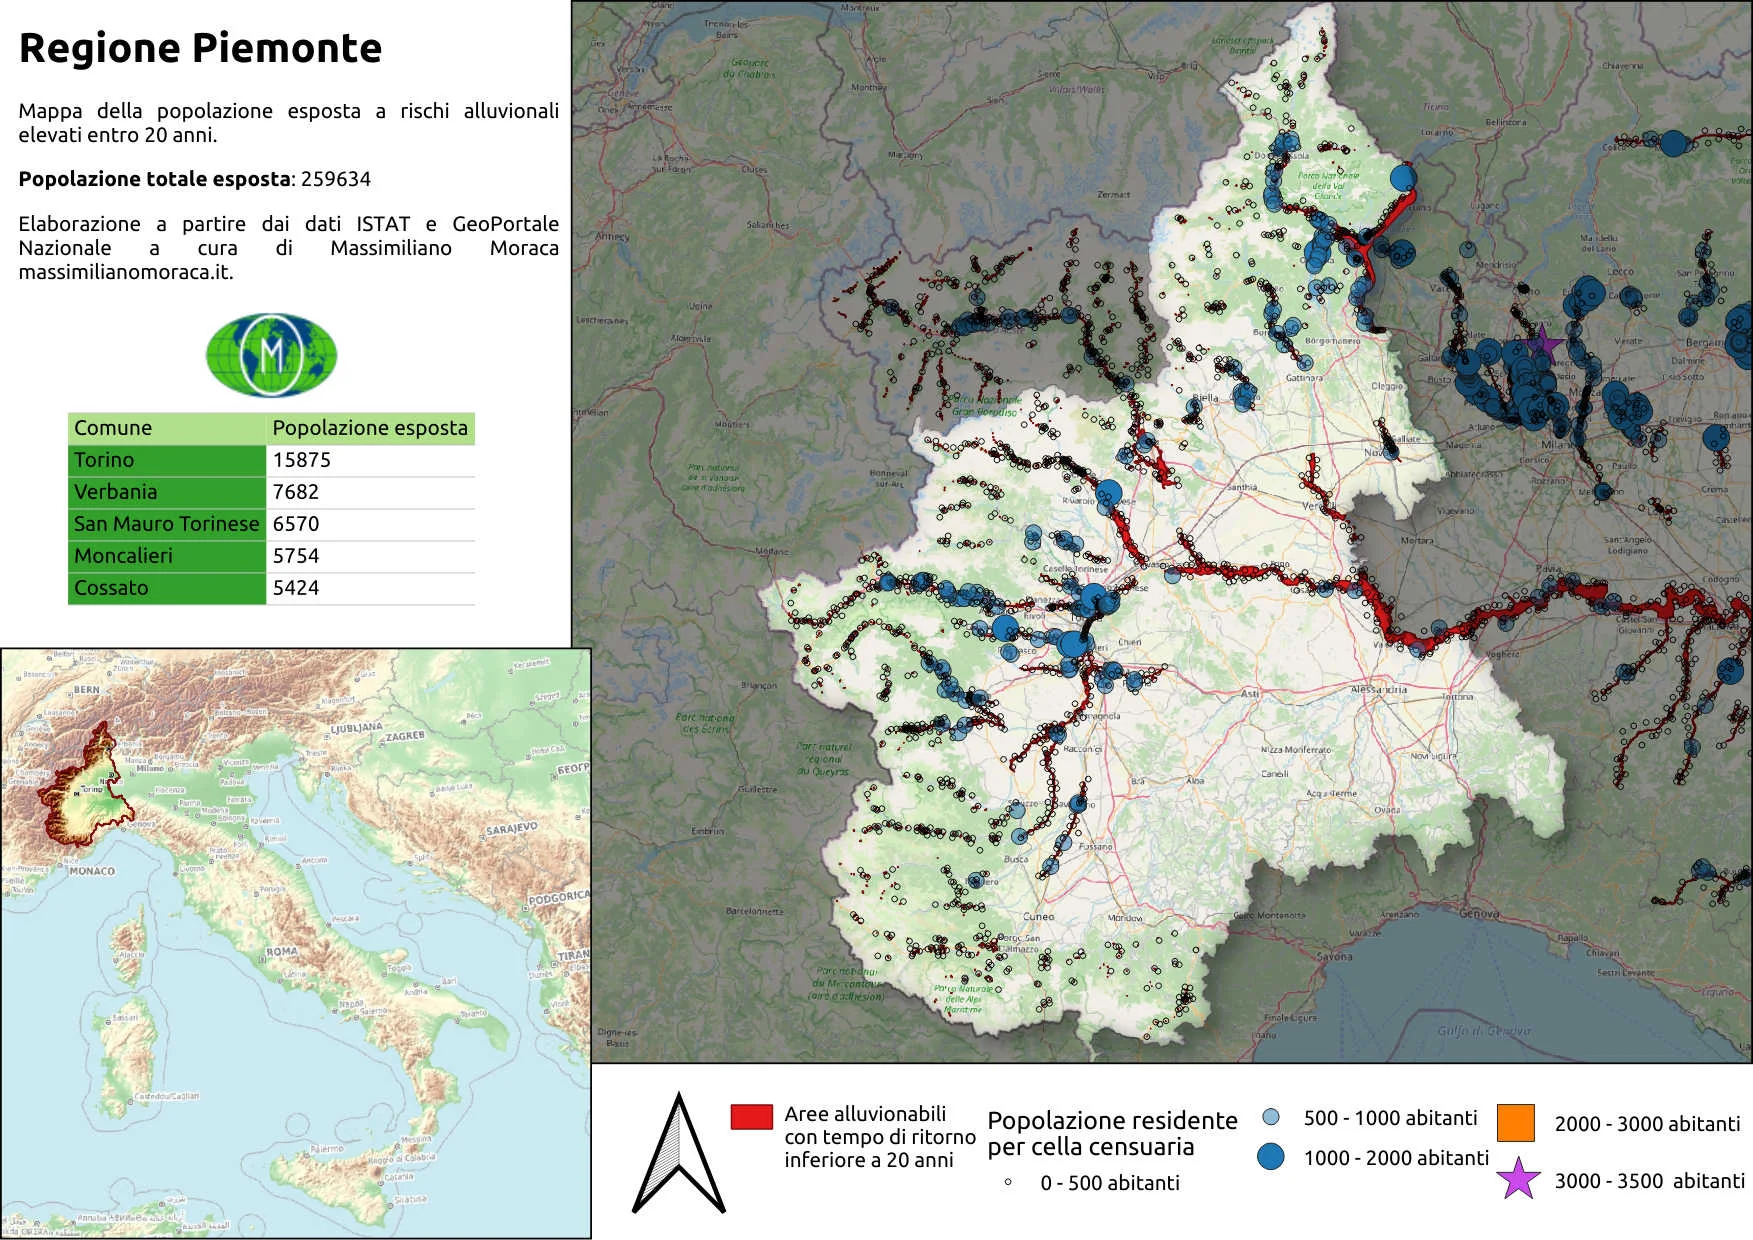
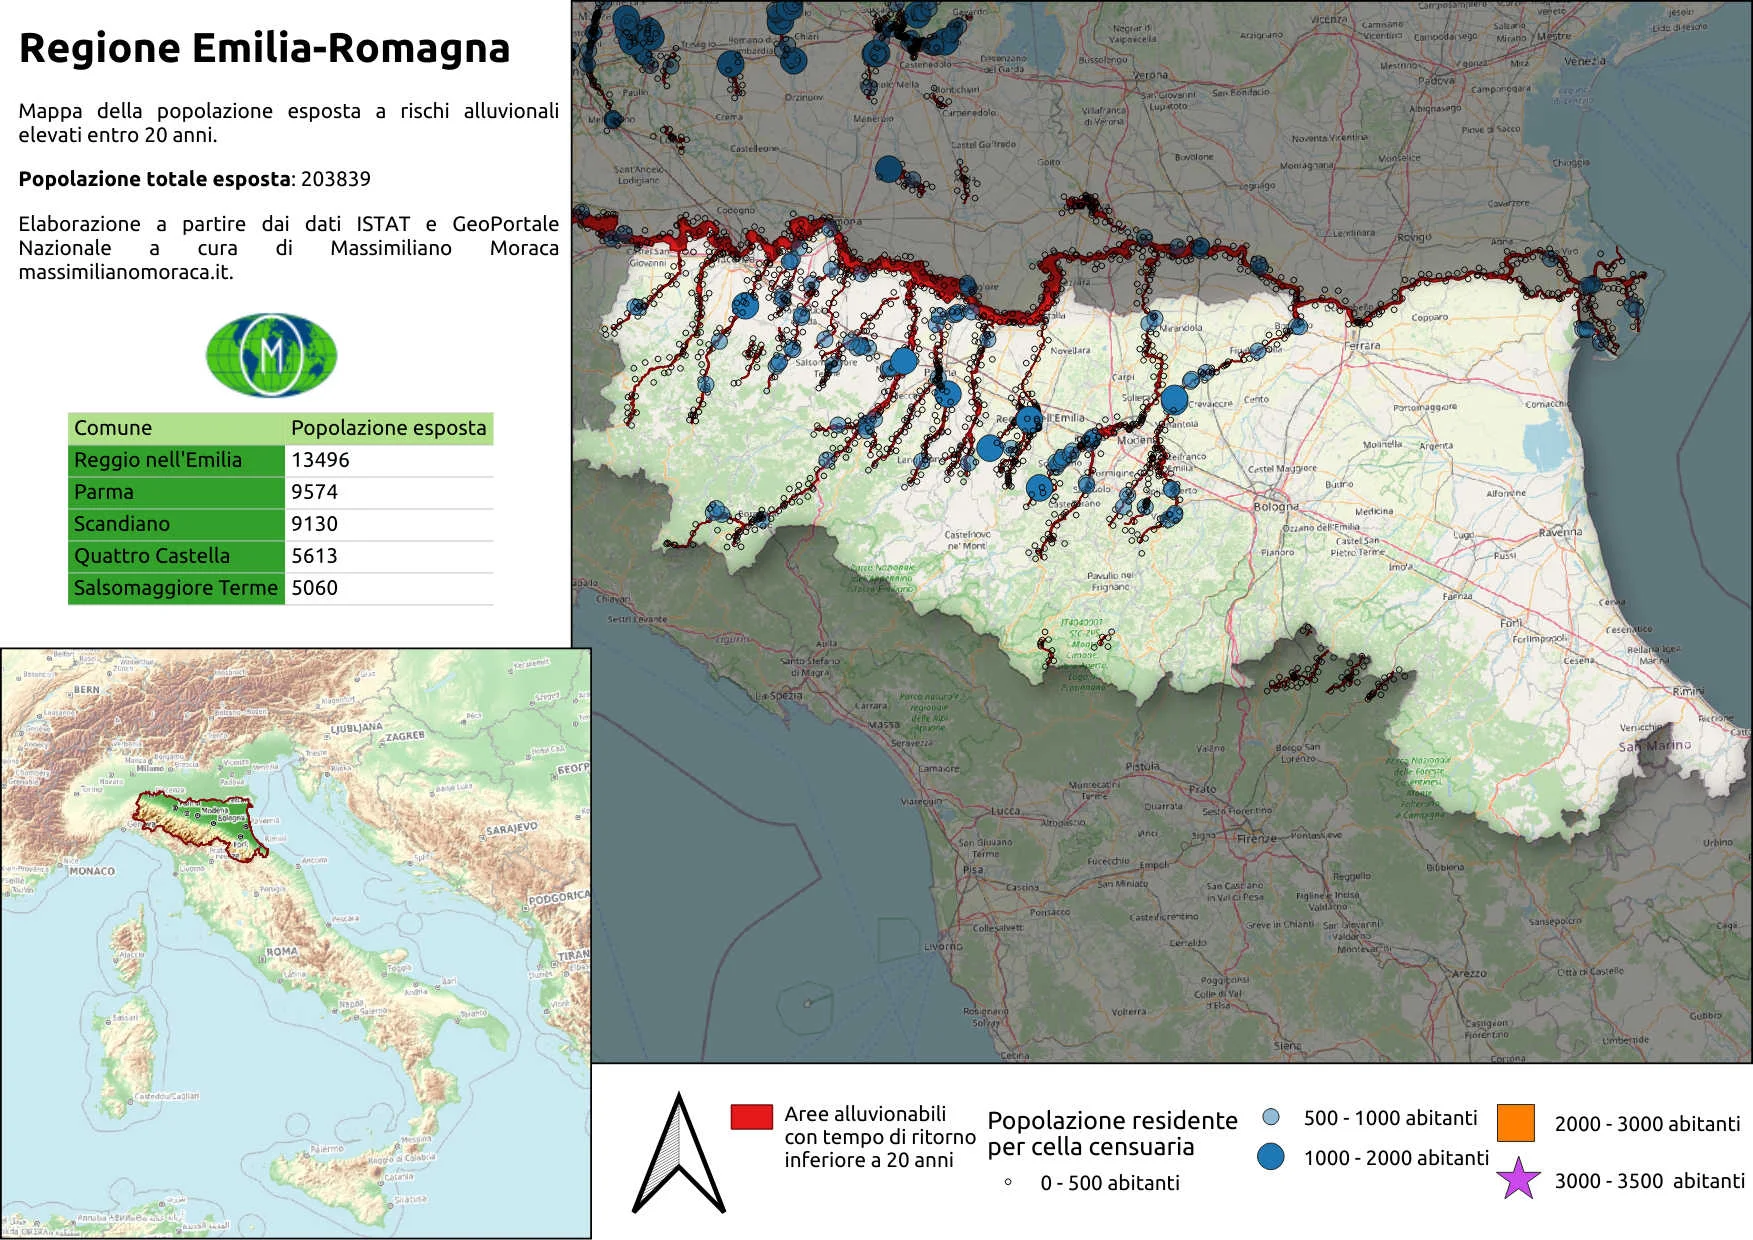
The following maps were born from this analysis of mine.
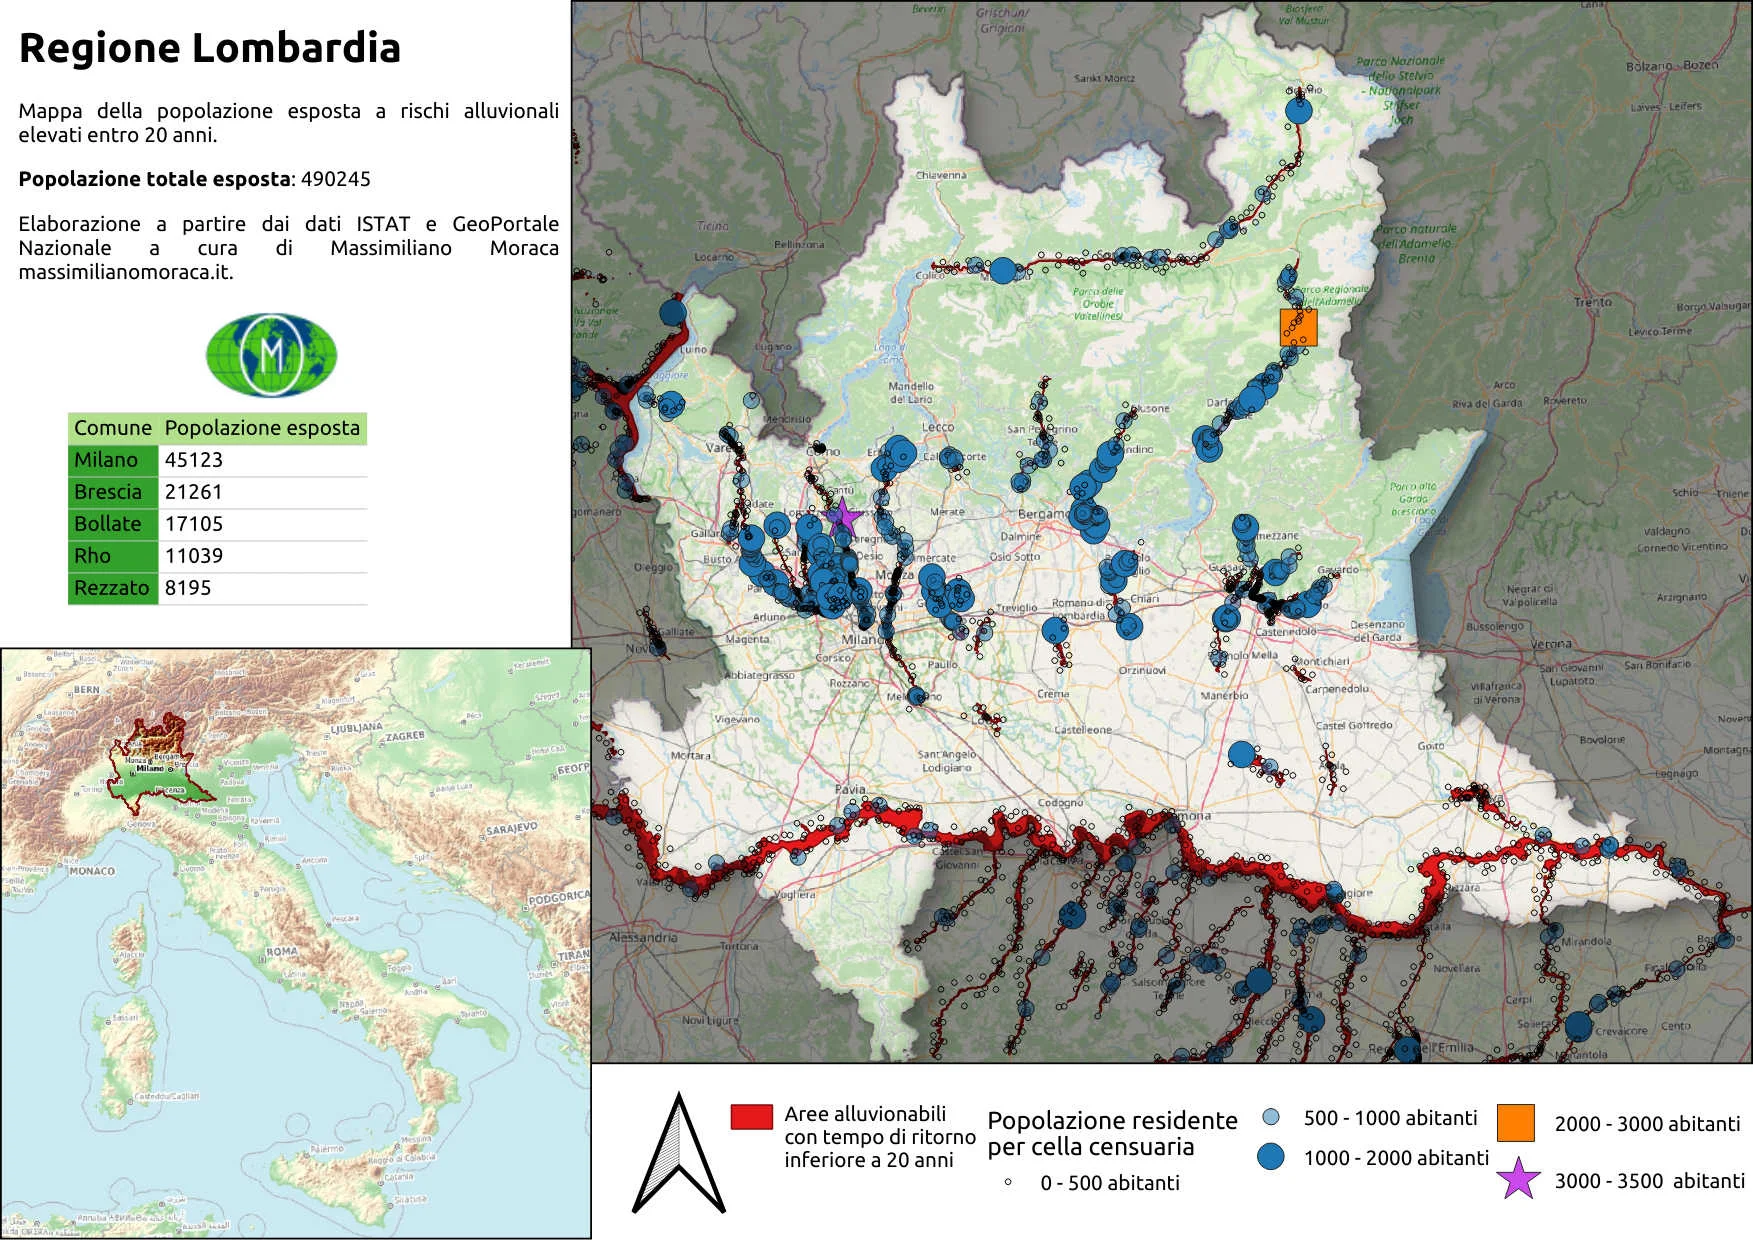
It was impressive for me to see that the area at most Italy's high risk is that of Milan with 45 thousand residents at risk. In general it is Lombardy being the region with the most high risk with an estimated 490 thousand residents. The sad ranking of the top five regions with resident populations at risk is the following:
- Lombardy - 490,295
- Piedmont - 259,634
- Emilia Romagna - 203,839
- Campania - 162,640
- Aosta Valley - 43,337
The PNRR has deployed 3.6 billion euros to combat hydrogeological instability; money that I hope will not be distributed like rain but only following concrete, feasible and effective projects. In a hearing in the Senate the National Council of Geologists agreed much complained about the lack of funds allocated for damage from landslides over the years, in turn a source of ANCE, amounting to 65 billion euros.
I was born in 1983, in almost 40 years of life I have heard about hydrogeological risk and I no longer know about the fact that we live in a country at risk. how many times. I lived through the Sarno disaster, more due to geographical proximity since I live about thirty kilometers away as the crow flies. I attended a specific degree course: environmental and territorial engineering. Yet it always seems to me that this issue and environmental issues in general are always given a sop, a misery.
If you are curious to delve deeper into the processed data you can find them attached to this article; they are present in a compressed geopackage inside which there is also the QGIS project. How they were processed is present here.