
An analysis of visibility allows you to establish which portions of the landscape are visible to an observer placed in a certain place and at a certain altitude. This type of analysis is important for many fields and applicable at various scales.
It is used, for example, to verify the visual impact of a wind turbine; another field of application can be the identification of shooting corridors in a crime scene just to give an example of a field in which GIS could sometimes be involved.
Fundamental data for this type of analysis is the DEM. Regardless of the type of DEM at our disposal (DSM or DTM) of importance is its spatial resolution. As the resolution of the DEM decreases, the resources needed by the PC to process the result increase. The commitment of resources also varies further depending on the radius of influence set, for example, considering a DSM with a celsize of 1m, fewer resources will be needed to process the visibility analysis. if you use a 1km radius of influence compared to using a 10km one.
For this article I will use the DEM20 of Ispra, a DTM with a celsize of 20m freely downloadable from here. For processing I will use QGIS and the geoalgorithm r.viewshed of GRASS GIS. Technically this operation is called VIEWSHED and all the best GIS software should be able to carry out this type of analysis. Further input data is the observation point which for convenience I physically inserted it into the TOC but, as you will see later, for the analysis you only need its coordinates.
As a first step we must search for our geoalgorithm in the Processing Toolbox. As you can see, just write the first letters of r.viewshed to immediately highlight what that we are looking for.
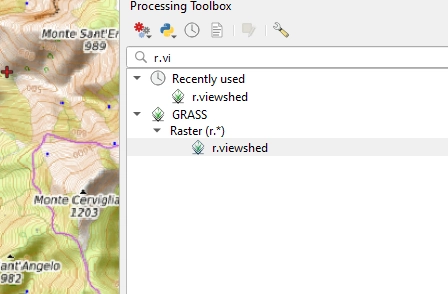
If you're wondering why two results appeared on me, the reason is: because I already have used r.viewshed previously and therefore appears in Recently used. The GUI for QGIS looks like the following image, I will explain it to you. just some of the settings to use, the most commonly used, for the others I refer you to the official guide of the geoalgorithm that I shared with you before.

The elevation, point 1, as the name suggests, refers to the DEM that will have to be use r.viewshed for processing; I obviously inserted the one used in this article.
The coordinates of the POI, point 2, are the coordinates of the point with which to start the processing. And’ You can insert them either manually or capture them from the canvas by clicking on the three dots to the right of the text box.
The visibility radius, point 3, is the maximum distance you want to investigate from the observation point. In this test I set 10km overlooking some factors such as the fact that the earth's surface curves beyond 5km away from the observation point; this it means that just as ships on the horizon disappear starting from the keel, so too does the visibility analysis. is influenced by this factor. Another parameter that I excluded is the refraction effect of light due to the atmosphere, based on which the result also changes significantly, I invite you to carry out some tests using the dataset attached to this article.
We come to point 4, it is trivially the maximum amount of RAM that can be engage the geoalgorithm. Going back to what was said at the beginning of the article about resolution, you must remember that resolution and RAM are inversely proportional. You choose which combination is best based on the DEM you use but above all on the maximum RAM of your PC. improve. I set it to around ¼ of the total RAM I have available, it is not a fixed rule but if you have other programs running by not dedicating all your RAM to r.viewshed you will be able to continue using them.
The point 5 refers to the type of processing output. This will be always a raster but since I didn't need to visualize the parts of the landscape that are not visible, I preferred to save time by having only the visible ones as output. Alternatively I would have had to tick the upper box to obtain both the visible and non-visible areas and then I would have had to make a mask with the Raster Calculator to get the desired result.
The rest of the parameters are optional, others set by default but, as I said previously, they are very well explained in the guide. At this point we can start our analysis by clicking on Run.
You may be wondering which one is the target of this processing?
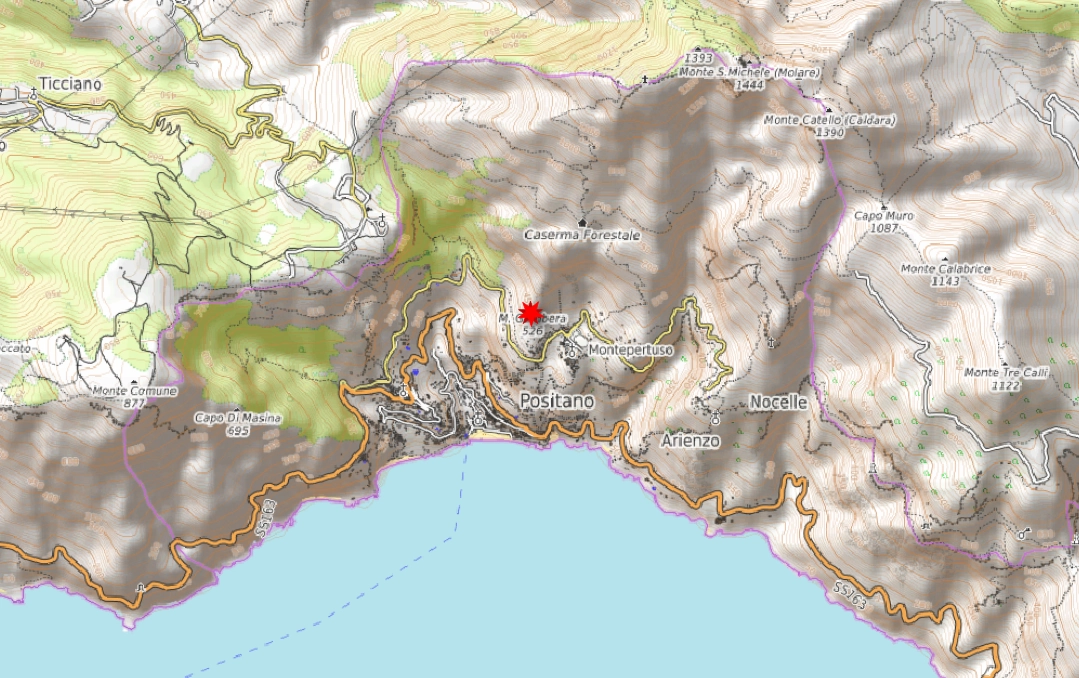
We want to understand if the Positano beach is visible from the POI which has the coordinates set in the geoalgorithm.
We are in fact on the Amalfi Coast, in a point of Monte Gambera at 526 m above sea level.
REMEMBER THAT the result of a visibility analysis is strongly influenced by the celsize of the DEM, this it means that as the celsize decreases the quality increases. of the final processing. At parity of settings a DEM with a 1m celsize returns a quality work. much higher than a DEM with a 20m celsize.
Here is the result of the processing:

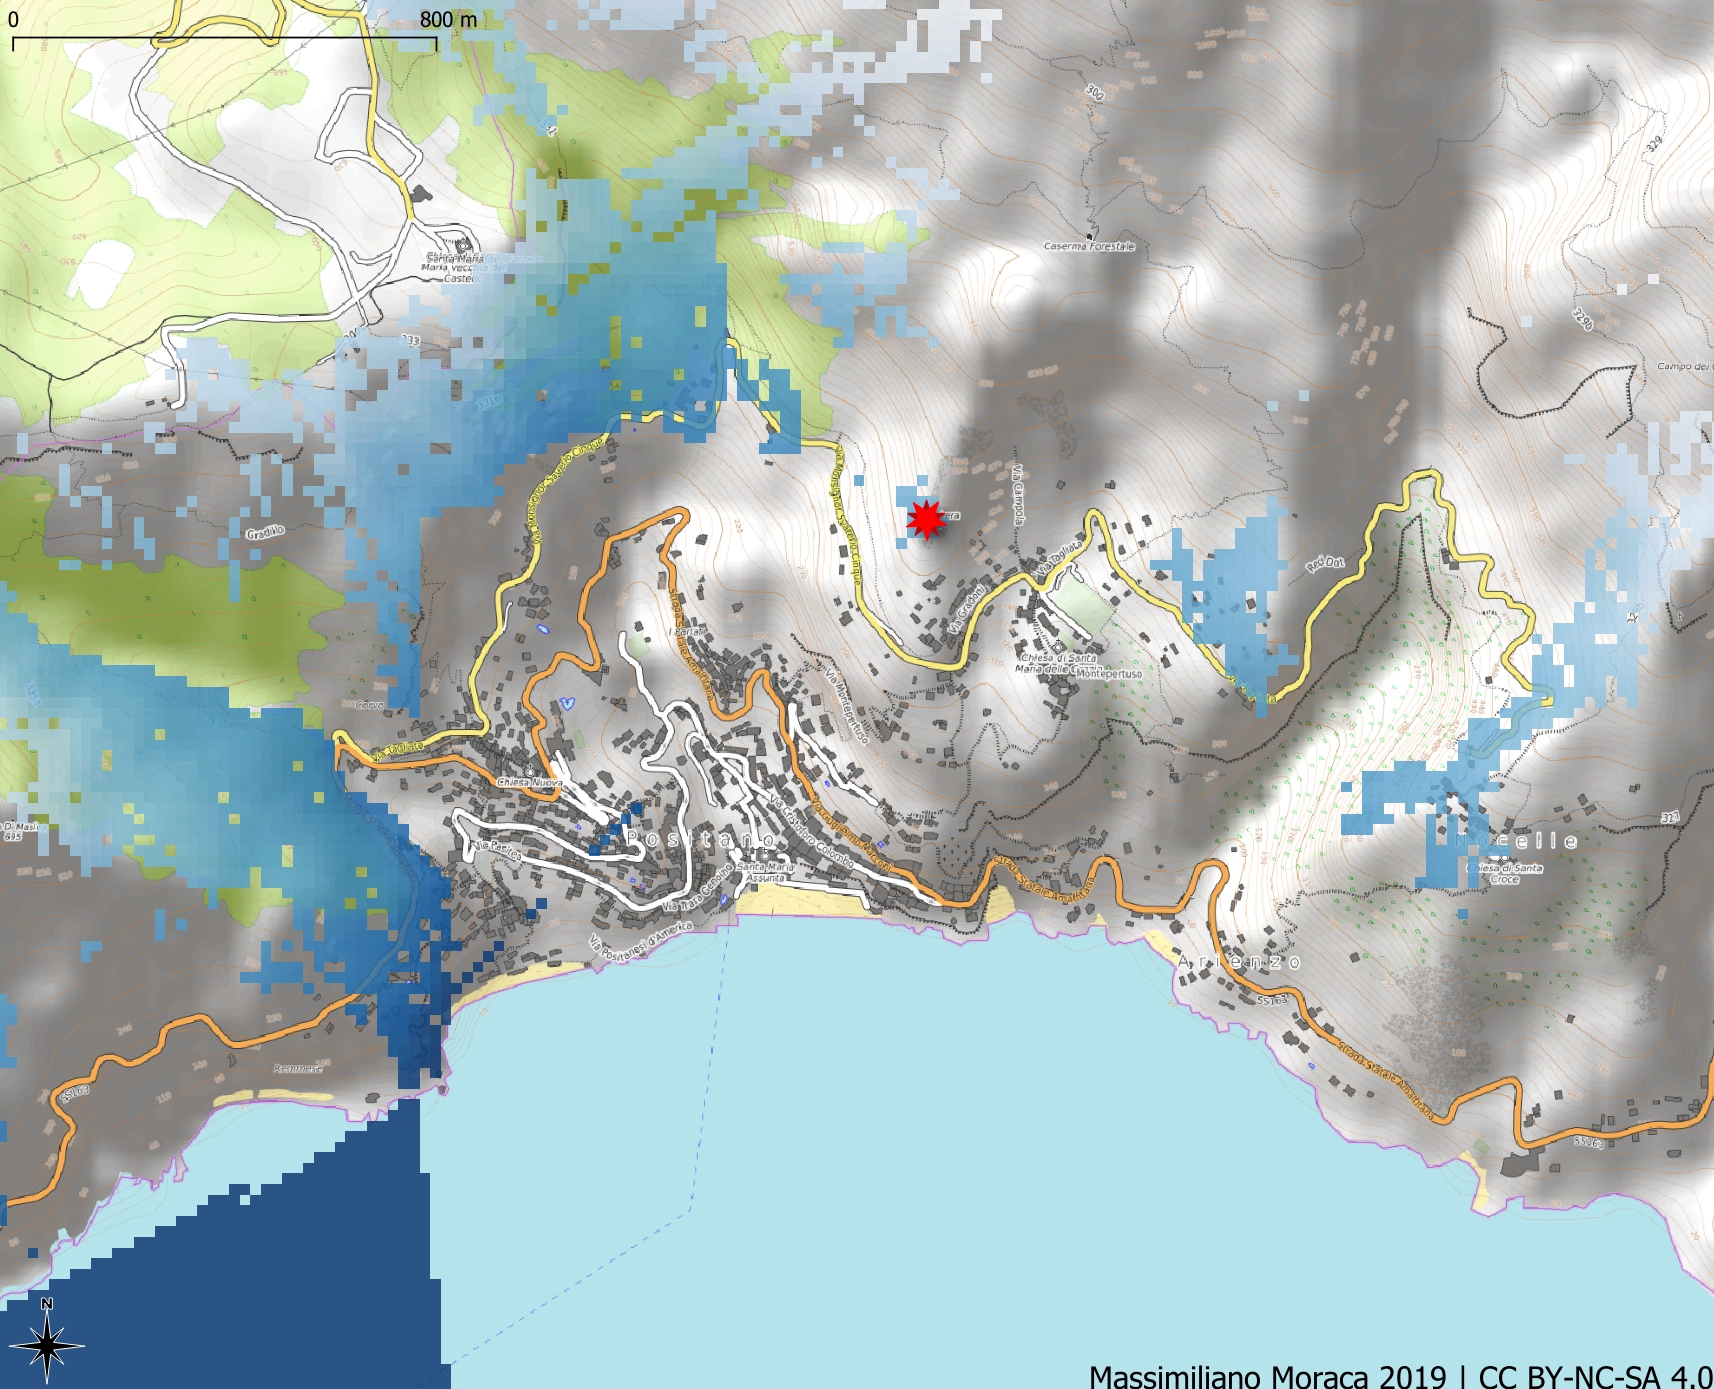
How can you seeing from the chosen point is not It is possible to see the beach of Positano as it is it does not fall into any blue scale area. From that point important portions of the coast are not visible.
The result is real?For the resolution of the DEM used yes.
You can improve? Certain! But a lower resolution DEM is needed.
In the attached dataset you will find all the data I used for this article and 10 other POIs with which you can test other settings and visibility rays.
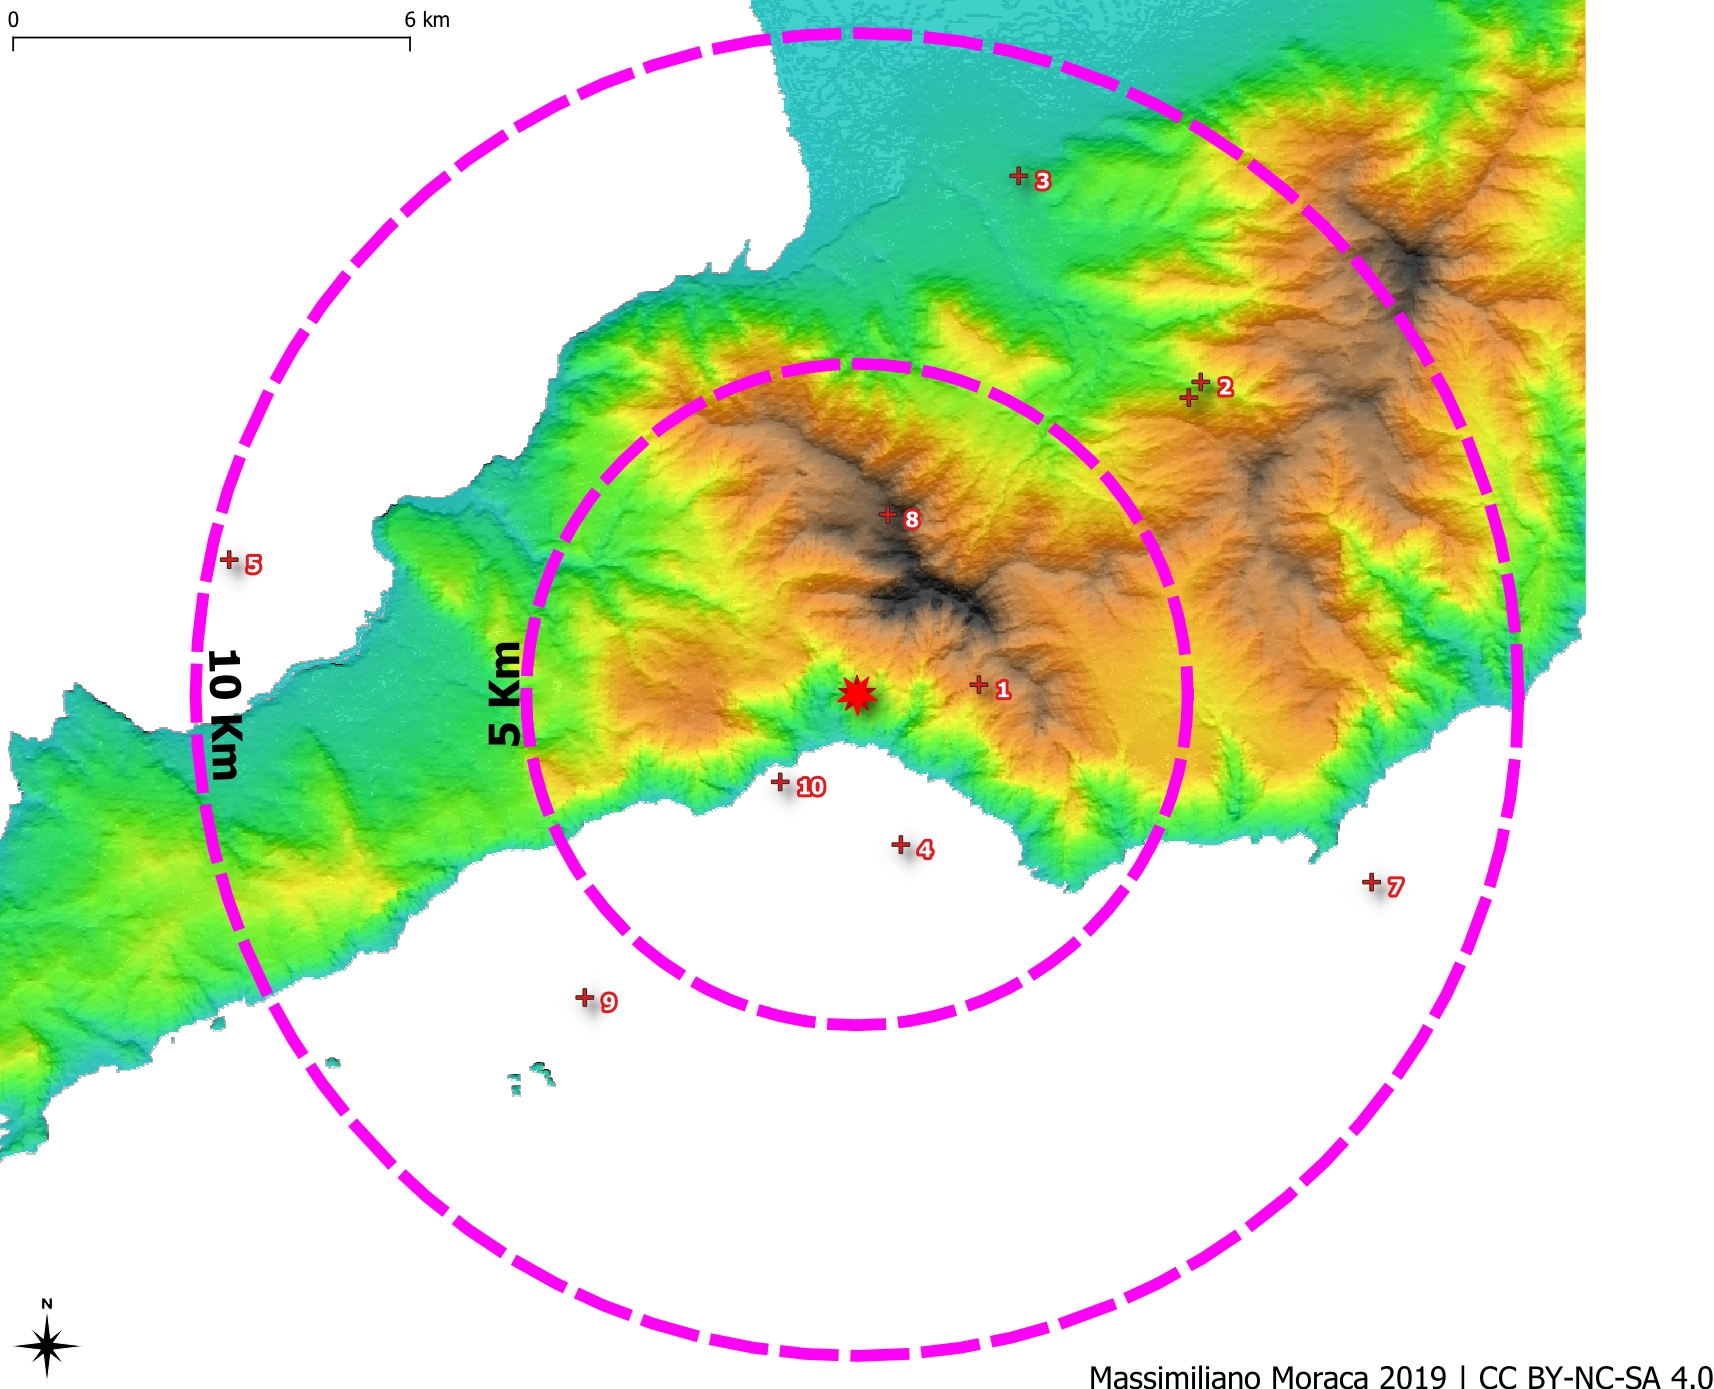
For example: is it possible to see a few km off the coast of Sorrento (POI 5) within a radius of 10km?

Python
Are you familiar with Python? See how to get the same solved with this JupyterNotebook :)