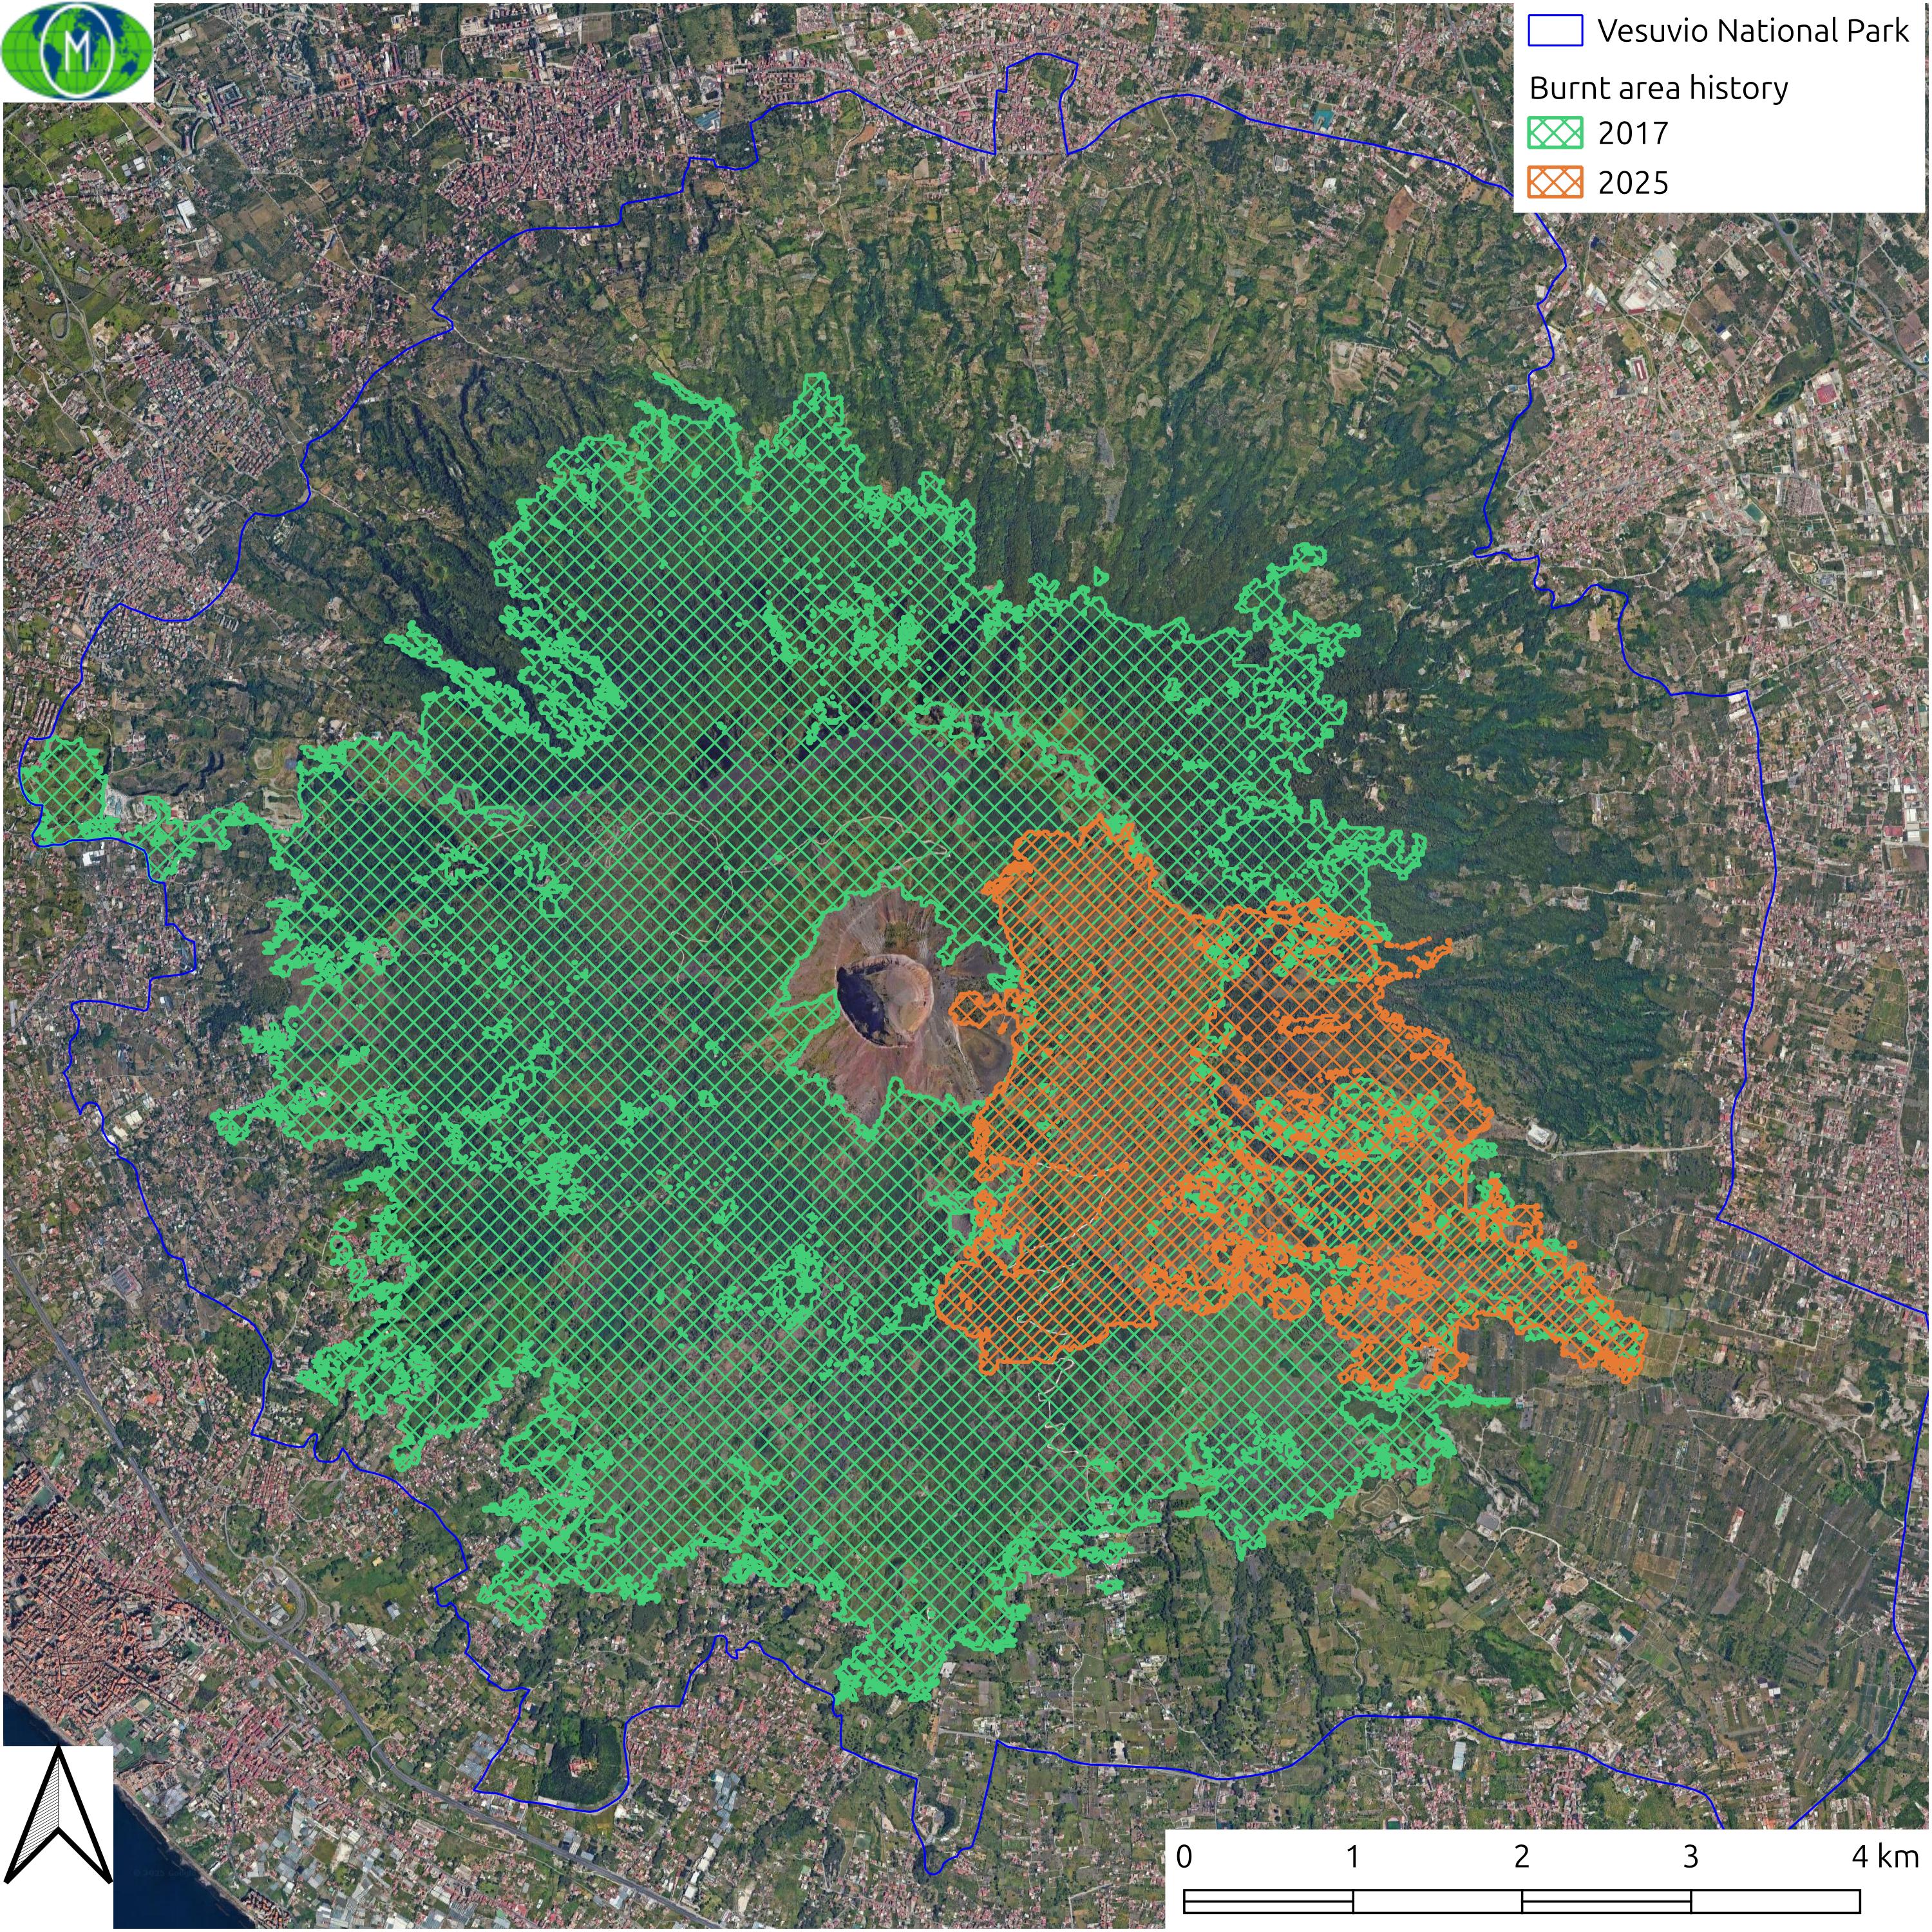
At the beginning of August 2025 the Vesuvius National Park is been hit by a new large fire after the events of the summer of 2017.
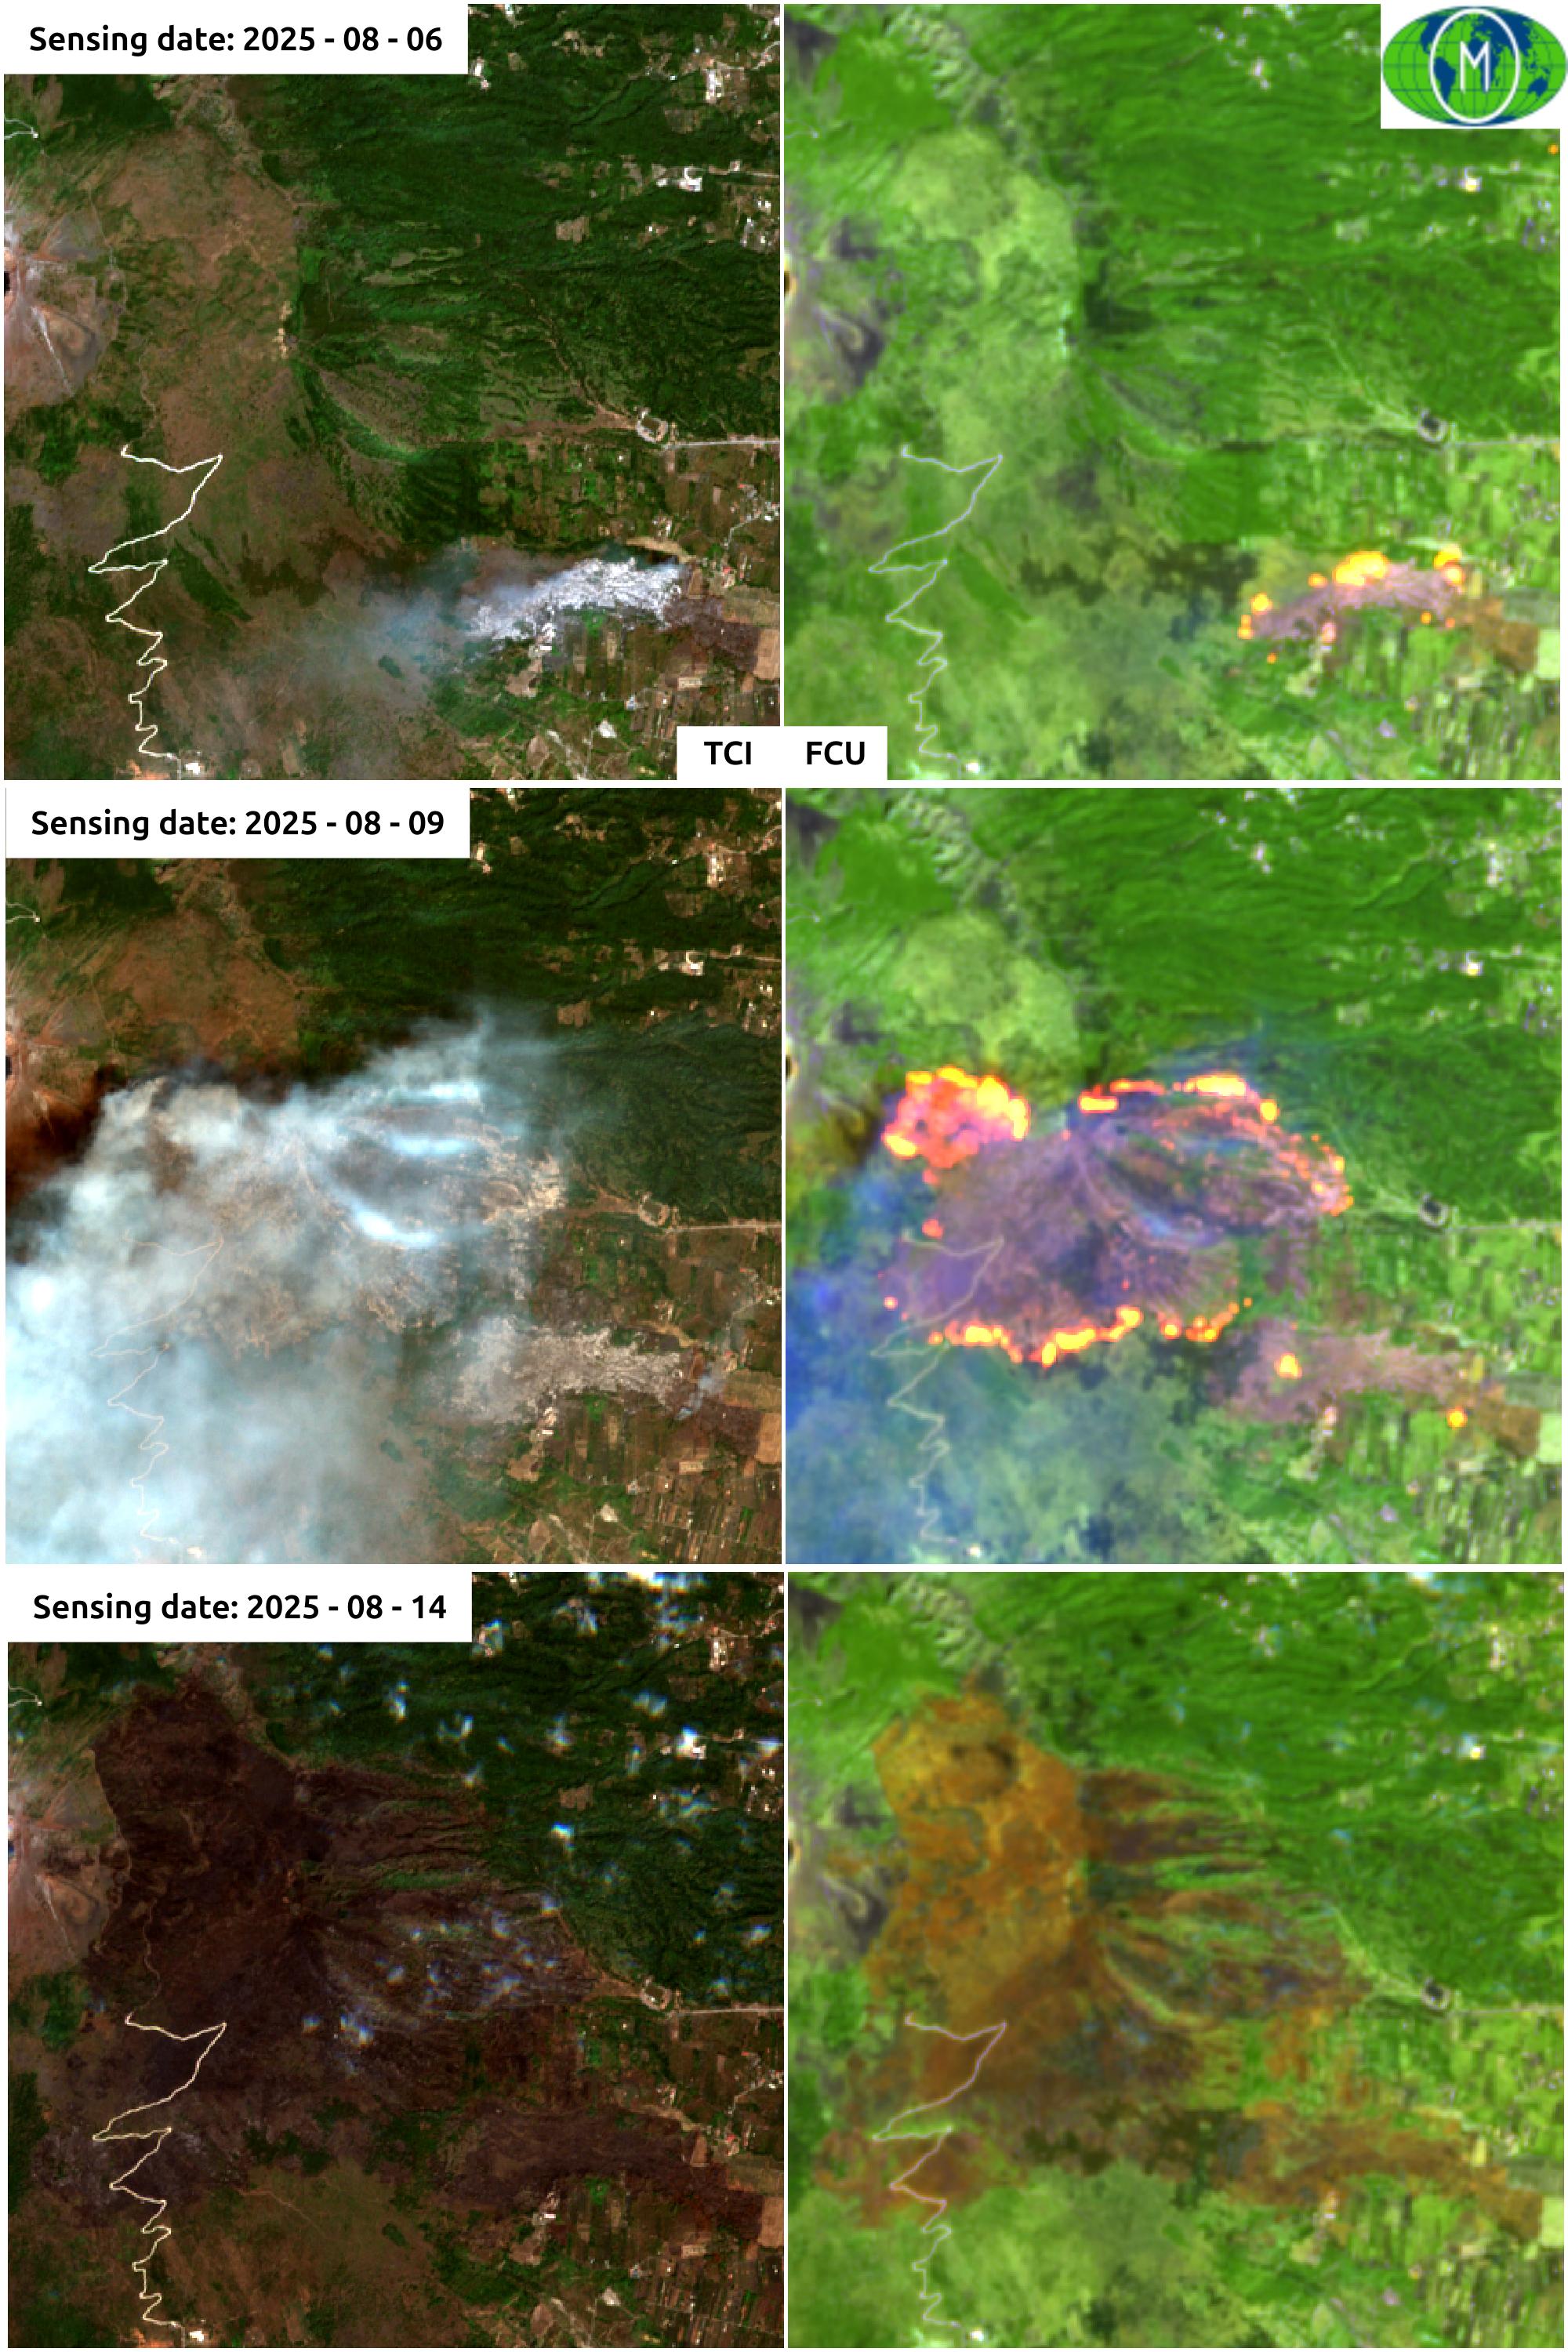
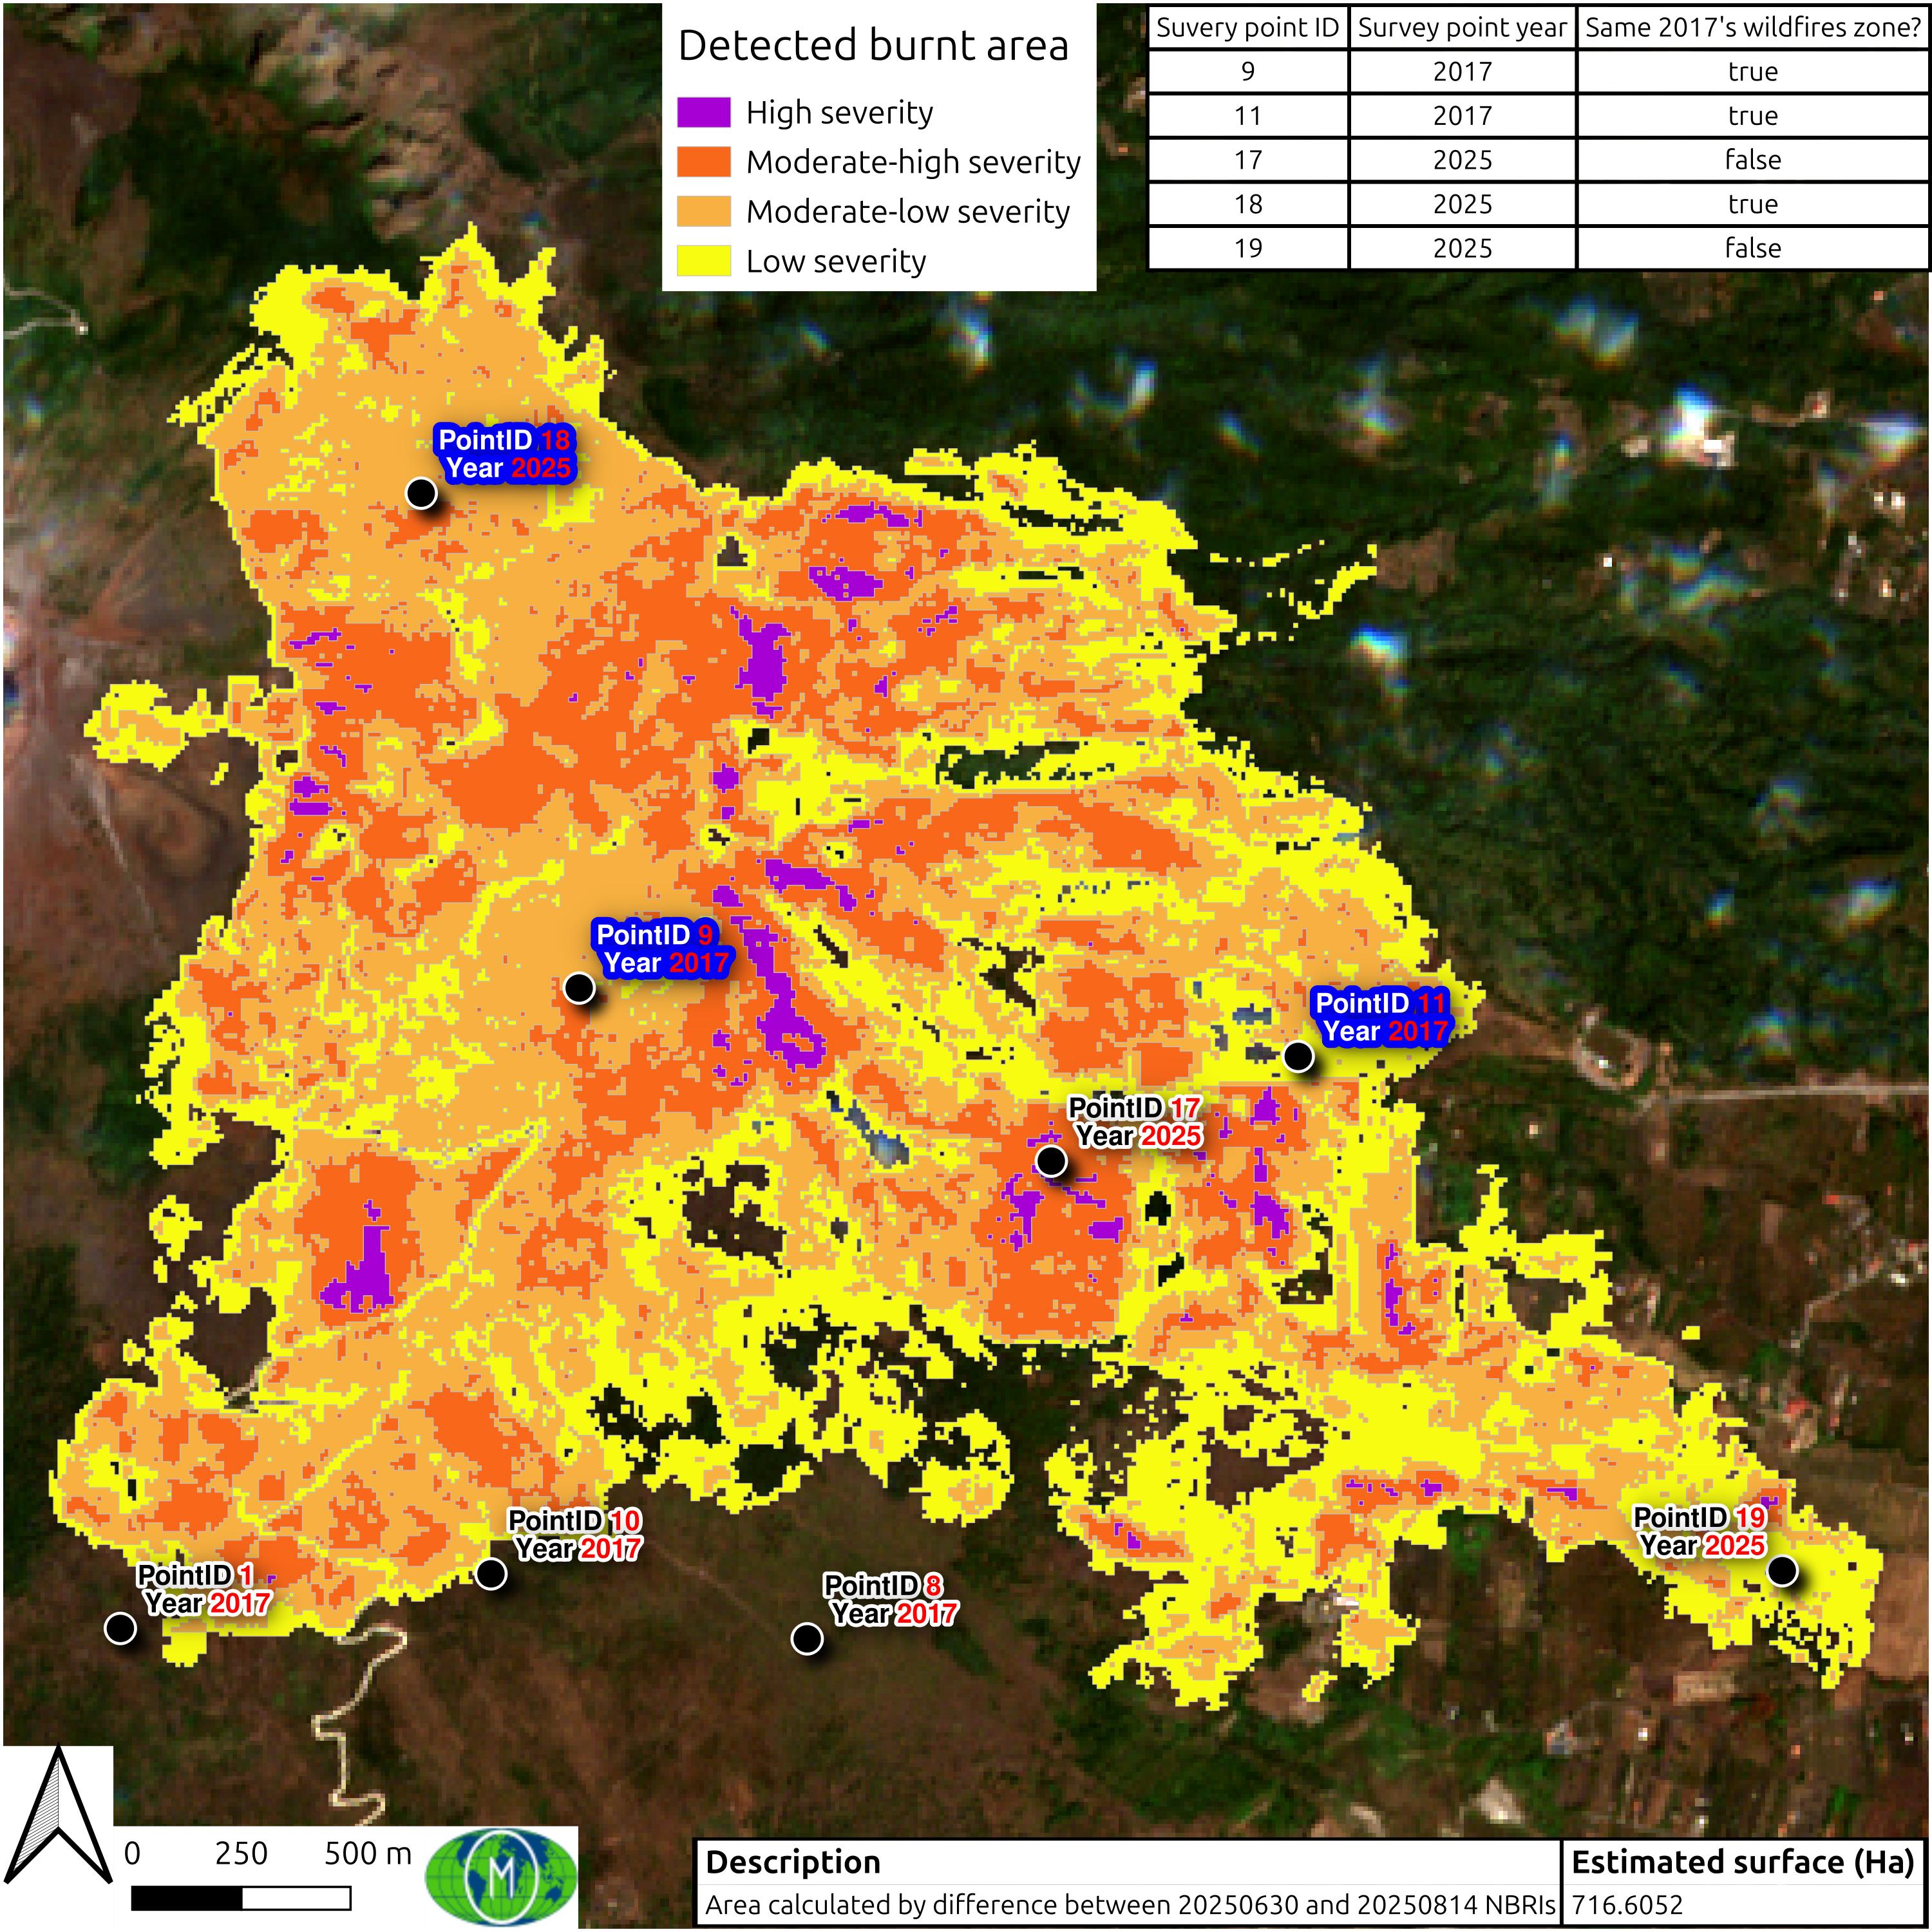
Thanks to the use of data from the Copernicus Sentinel 2 constellation I tried to estimate the extension of the area covered by the fire by extrapolating the intensity classes of damage and which areas of CLC2012 were affected. I preferred to use the CLC2012 and not the CLC2018 because it is in the latter it is already present the estimate of the perimeter of the areas affected by the 2017 fire and the extent of which I am unable to determine of the damage; from direct experience not all of the perimeter area was totally destroyed. I used two Sentinel 2 scenes for this analysis:
- S2B_MSIL2A_20250630T095029_N0511_R079_T33TVF_20250630T120527
| Municipality | Extension in PNV (m2) | Extension in PNV (%) |
| Boscotrecase | 4,096,796 | 4.96% |
| Octavian | 9.379.583 | 11.35% |
| San Giuseppe Vesuviano | 2.871.204 | 3.47% |
| Terzigno | 16.642.077 | 20.13% |
| Torre del Greco | 13.627.623 | 16.48% |
| Trecase | 2,597,606 | 3.14% |
| Municipality | CLC2012 | High severity | Moderate-high severity | Moderate-low severity | Low severity | Not burnt |
| Boscotrecase | Complex cultivation patterns | 1.140.182 | ||||
| Coniferous forest | 300 | 59.881 | 90.543 | 33.790 | 549.240 | |
| Land mainly occupied by agriculture, with significant areas of natural vegetation | 1.029.296 | |||||
| Mixed forest | 9.734 | 42.577 | 16.465 | 152.402 | ||
| Transitional woodland-shrub | 13.186 | 48.530 | 65.547 | 518.150 | ||
| Octavian | Broad-leaved forest | 312 | 278 | 2,087,816 | ||
| Complex cultivation patterns | 47.428 | |||||
| Fruit trees and berry plantations | 25.332 | |||||
| Land mainly occupied by agriculture, with significant areas of natural vegetation | 2,638,788 | |||||
| Mixed forest | 925 | 10,599 | 3.023 | 138 | 1.075.143 | |
| Sparsely vegetated areas | 3,600 | 30.724 | 40.705 | 216.926 | ||
| Transitional woodland-shrub | 18.288 | 574.672 | 1,014,979 | 261.407 | 357.216 | |
| San Giuseppe Vesuviano | Broad-leaved forest | 5,600 | 39,799 | 30.611 | 96.035 | 1,099,939 |
| Land mainly occupied by agriculture, with significant areas of natural vegetation | 1.223.380 | |||||
| Mixed forest | 341 | 8.567 | 19.552 | 11.296 | 9.727 | |
| Transitional woodland-shrub | 793 | 1.948 | 2.140 | 141.717 | ||
| Terzigno | Broad-leaved forest | 2.627 | 9.271 | 6.520 | 1.587 | 1.612 |
| Complex cultivation patterns | 1,600 | 19,896 | 53.610 | 107.992 | 2.766.179 | |
| Coniferous forest | 5,300 | 80.221 | 339.616 | 684.190 | 1,077,833 | |
| Fruit trees and berry plantations | 16.614 | 78.258 | 115.551 | 89.138 | 3.640.587 | |
| Land mainly occupied by agriculture, with significant areas of natural vegetation | 290.099 | |||||
| Mixed forest | 37.628 | 398.466 | 460.445 | 399.086 | 1.322.901 | |
| Transitional woodland-shrub | 63,477 | 430.790 | 548.751 | 376.666 | 1.395.249 | |
| Torre del Greco | Broad-leaved forest | 2,261,934 | ||||
| Complex cultivation patterns | 1,892,790 | |||||
| Coniferous forest | 47 | 281 | 685 | 3,499,757 | ||
| Continuous urban fabric | 177.078 | |||||
| Land mainly occupied by agriculture, with significant areas of natural vegetation | 767.119 | |||||
| Mixed forest | 1,757,640 | |||||
| Transitional woodland-shrub | 351 | 1.415 | 3.547 | 1.713.021 | ||
| Trecase | Complex cultivation patterns | 1,529,580 | ||||
| Coniferous forest | 3.193 | 21.453 | 24.082 | 498.828 | ||
| Land mainly occupied by agriculture, with significant areas of natural vegetation | 56.405 | |||||
| Transitional woodland-shrub | 24.846 | 52.955 | 27,779 | 201.792 |
| Municipality | CLC2012 | Pre 2025 (m2) | Pre 2025 (%) | Post 2025 (m2) | Post 2025 (%) | Difference (m2) | Difference (%) |
| Boscotrecase | Complex cultivation patterns | 1.140.182 | 27.83% | 1.140.182 | 27.83% | 0 | 0.00% |
| Coniferous forest | 733.754 | 17.91% | 549.240 | 13.41% | 184.514 | 25.15% | |
| Land mainly occupied by agriculture, with significant areas of natural vegetation | 1.029.296 | 25.12% | 1.029.296 | 25.12% | 0 | 0.00% | |
| Mixed forest | 221.178 | 5.40% | 152.402 | 3.72% | 68.776 | 31.10% | |
| Transitional woodland-shrub | 645.413 | 15.75% | 518.150 | 12.65% | 127.263 | 19.72% | |
| Octavian | Broad-leaved forest | 2.088.406 | 22.27% | 2,087,816 | 22.26% | 590 | 0.03% |
| Complex cultivation patterns | 47.428 | 0.51% | 47.428 | 0.51% | 0 | 0.00% | |
| Fruit trees and berry plantations | 25.332 | 0.27% | 25.332 | 0.27% | 0 | 0.00% | |
| Land mainly occupied by agriculture, with significant areas of natural vegetation | 2,638,788 | 28.13% | 2,638,788 | 28.13% | 0 | 0.00% | |
| Mixed forest | 1,089,828 | 11.62% | 1.075.143 | 11.46% | 14.685 | 1.35% | |
| Sparsely vegetated areas | 291.955 | 3.11% | 216.926 | 2.31% | 75.029 | 25.70% | |
| Transitional woodland-shrub | 2.226.562 | 23.74% | 357.216 | 3.81% | 1.869.346 | 83.96% | |
| San Giuseppe Vesuviano | Broad-leaved forest | 1.271.984 | 44.30% | 1,099,939 | 38.31% | 172.045 | 13.53% |
| Land mainly occupied by agriculture, with significant areas of natural vegetation | 1.223.380 | 42.61% | 1.223.380 | 42.61% | 0 | 0.00% | |
| Mixed forest | 49.483 | 1.72% | 9.727 | 0.34% | 39.756 | 80.34% | |
| Transitional woodland-shrub | 146.598 | 5.11% | 141.717 | 4.94% | 4.881 | 3.33% | |
| Terzigno | Broad-leaved forest | 21,617 | 0.13% | 1.612 | 0.01% | 20.005 | 92.54% |
| Complex cultivation patterns | 2,949,277 | 17.72% | 2.766.179 | 16.62% | 183.098 | 6.21% | |
| Coniferous forest | 2.187.160 | 13.14% | 1,077,833 | 6.48% | 1.109.327 | 50.72% | |
| Fruit trees and berry plantations | 3.940.148 | 23.68% | 3.640.587 | 21.88% | 299.561 | 7.60% | |
| Land mainly occupied by agriculture, with significant areas of natural vegetation | 290.099 | 1.74% | 290.099 | 1.74% | 0 | 0.00% | |
| Mixed forest | 2,618,526 | 15.73% | 1.322.901 | 7.95% | 1.295.625 | 49.48% | |
| Transitional woodland-shrub | 2,814,933 | 16.91% | 1.395.249 | 8.38% | 1,419,684 | 50.43% | |
| Torre del Greco | Broad-leaved forest | 2,261,934 | 16.60% | 2,261,934 | 16.60% | 0 | 0.00% |
| Complex cultivation patterns | 1,892,790 | 13.89% | 1,892,790 | 13.89% | 0 | 0.00% | |
| Coniferous forest | 3,500,770 | 25.69% | 3,499,757 | 25.68% | 1.013 | 0.03% | |
| Continuous urban fabric | 177.078 | 1.30% | 177.078 | 1.30% | 0 | 0.00% | |
| Land mainly occupied by agriculture, with significant areas of natural vegetation | 767.119 | 5.63% | 767.119 | 5.63% | 0 | 0.00% | |
| Mixed forest | 1,757,640 | 12.90% | 1,757,640 | 12.90% | 0 | 0.00% | |
| Transitional woodland-shrub | 1.718.334 | 12.61% | 1.713.021 | 12.57% | 5.313 | 0.31% | |
| Trecase | Complex cultivation patterns | 1,529,580 | 58.88% | 1,529,580 | 58.88% | 0 | 0.00% |
| Coniferous forest | 547.556 | 21.08% | 498.828 | 19.20% | 48,728 | 8.90% | |
| Land mainly occupied by agriculture, with significant areas of natural vegetation | 56.405 | 2.17% | 56.405 | 2.17% | 0 | 0.00% | |
| Transitional woodland-shrub | 307.372 | 11.83% | 201.792 | 7.77% | 105.580 | 34.35% |