
LIDAR (acronym from the English Light Detection and Ranging[1] or Laser Imaging Detection and Ranging) is a remote sensing technique that allows you to determine the distance of an object or surface using a laser pulse, as well as determining the concentration of chemical species in the atmosphere[1] and in bodies of water.
Definition of Wikipedia
These days I have If you happen to have to work on Lidar files, it is It was the first time I came across this type of file and first of all I thank the guys at GIS ITALIA for their invaluable support, without them I might still have been going crazy trying to figure out how to make the most of them.
Given the difficulties that I met, I decided to write this article which perhaps will help be useful to someone.
This article will be in effect a tutorial with attached exercise; in fact, in addition to describing the procedure I performed, I will insert some of the basic files that you can use to retrace the process and perhaps fix it better in your head.
I used the latest version of QGis LTR for this job, you can download it from here.
Let's get started!
The files that we have to load, as I said before, have the .xyz extension so we cannot load them with a simple "Add layer" but we will have to use a slightly different route. If you try to open one of these files with Windows Notepad, you will notice that it is composed of 3 columns: the first two show the coordinates and the third the height. In practice these files are composed of a set of points, each with its own coordinates and height. The files I used contain only this information but many others can be stored inside them such as density, exposure and all that. which can be "captured" with the LiDAR technique.
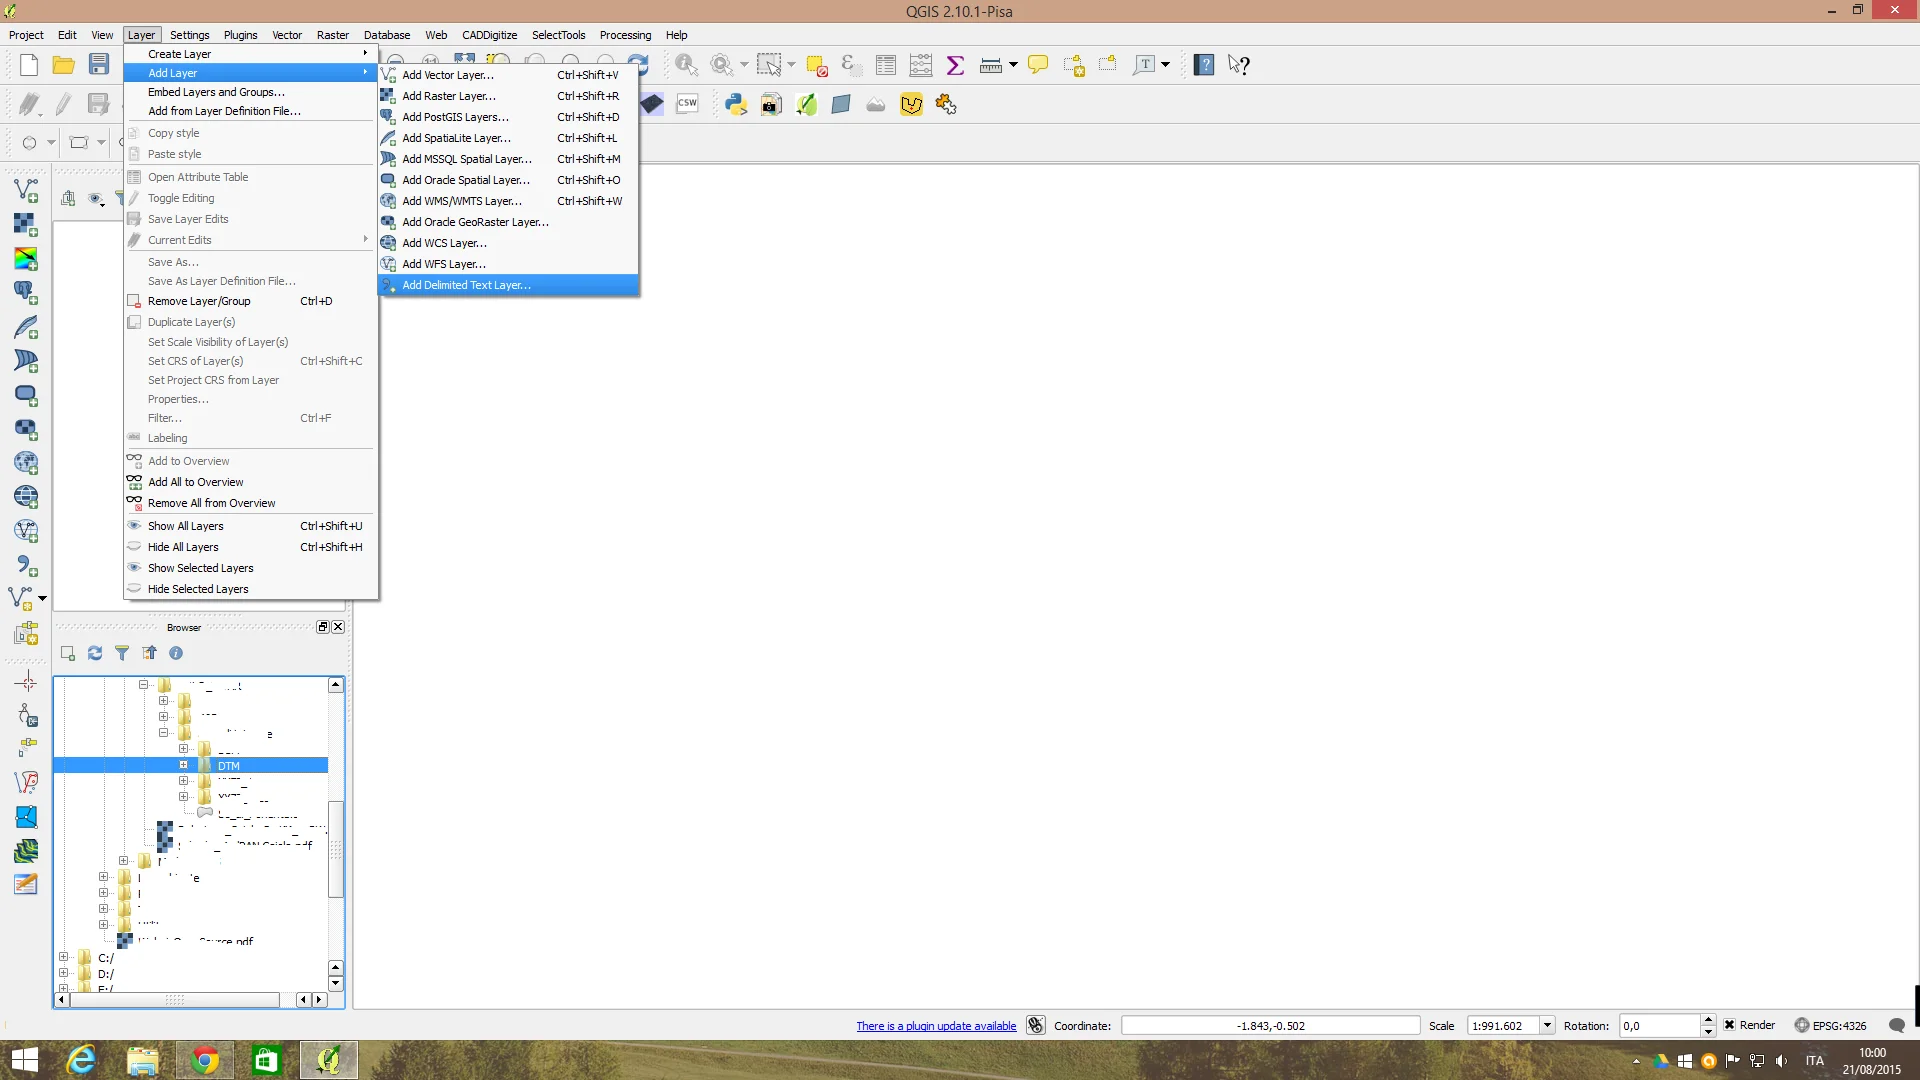
Having said this, the first step to take is just look at one of those files to "understand how it's done inside", in this way we will see It's easy to understand the procedure that will go into to describe. With QGis open go to Layer>Add Layer>Add Delimited Text Layer, as shown in the figure.
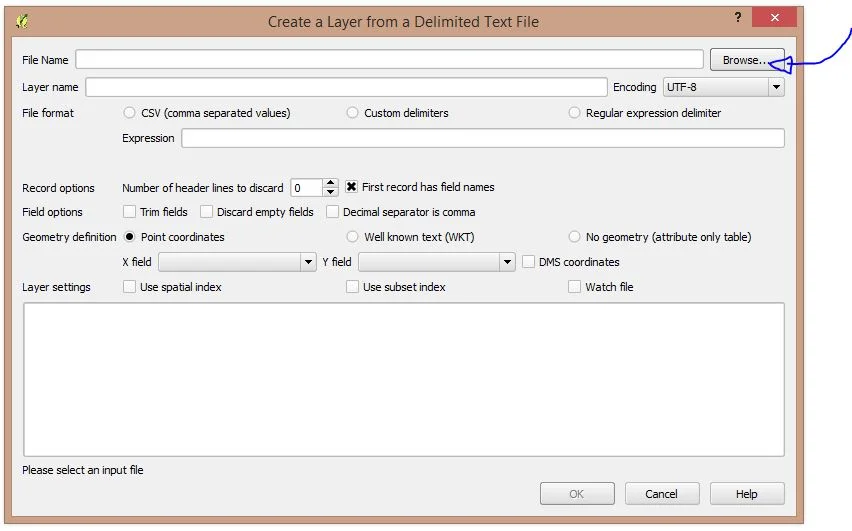
Now comes the delicate part, be very careful! Click on Add Delimited Text Layer and you will have the following screen in front of you:
Go to Browse, choose the file and load it like this. as explained in the next screen.
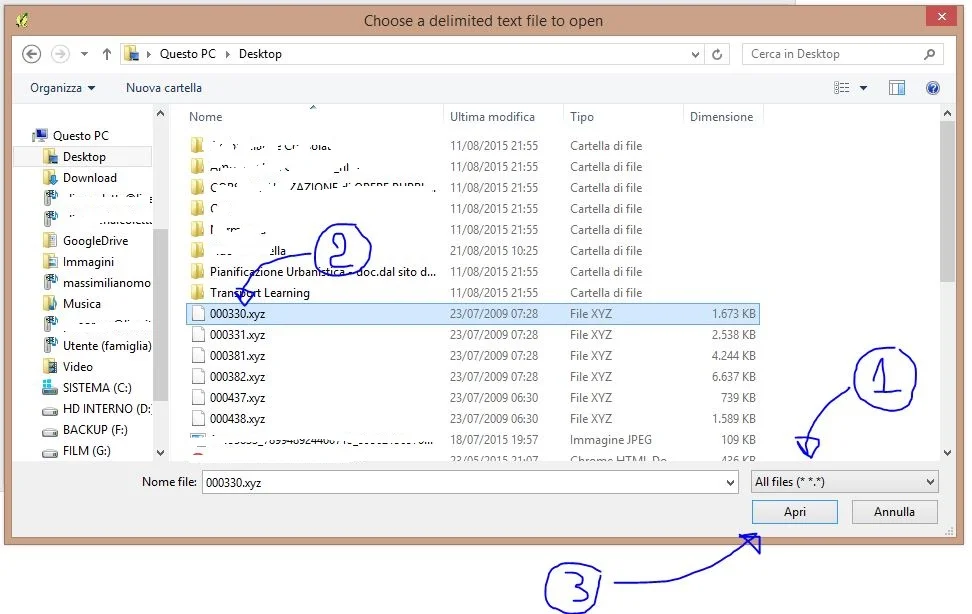
You will have noticed that this type of file must be loaded one by one, it is one of the boring parts of this operation... Once the file has been loaded you will have the following screen in front of you:
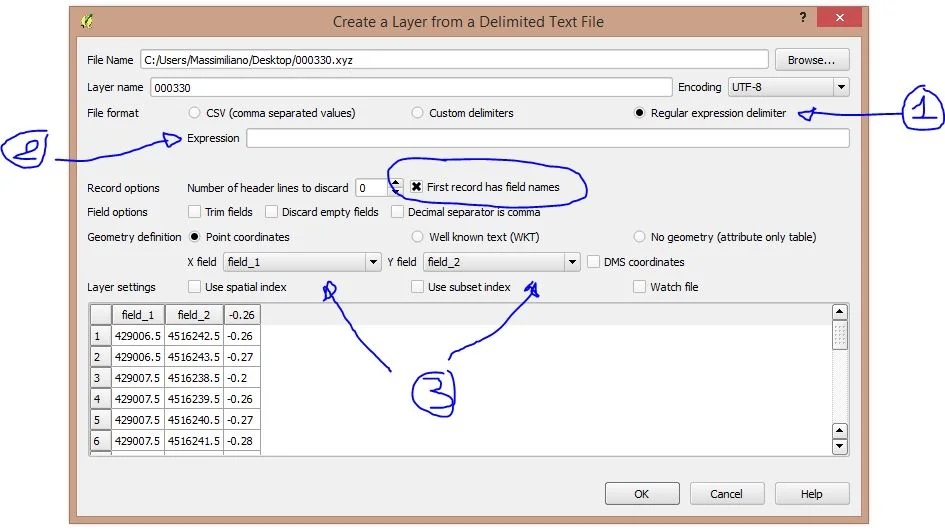
- select Regular expression delimiter, as you may have noticed there is of the space between the columns that define the individual files;
- go to Expression and insert the spaces between the columns, in this case there are two but in other files I have worked on there are fewer or even more. I told you to study the file to understand how the columns are delimited;
- now you need to indicate which columns bring with them longitude and latitude. If you have entered the spaces correctly you can choose them from the menu. drop-down menu that appears;
- important, no, VERY IMPORTANT! Uncheck First record as field names. This is because in this case the fields have no name and from the first they report coordinates and height, if you do not remove that check you will lose the first record, the first point in the list in practice will not be displayed. reported. Now you can click OK.
He will come to you required to enter the reference system as shown below.
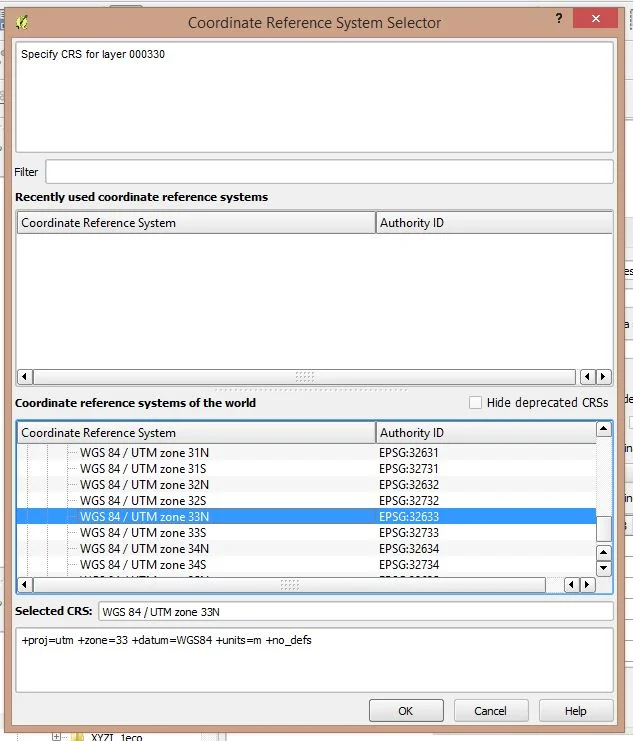
Once this is done you will have your beautiful point cloud in QGis, proceed with the previous steps to load all the files that I have passed to you in order to have them all active for the next operations.
What do we do with these files?
We can do a nice interpolation to extract contour lines, a hillshade, a slope, a relief and much more! First we do an interpolation using the appropriate plugin, the following will appear. the following screen:
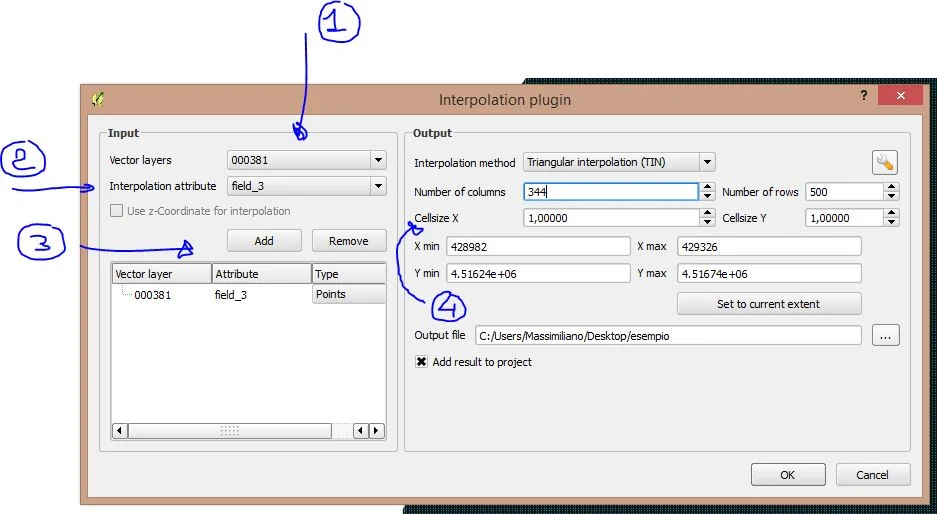
- choose the layer;
- indicate the column with the height attribute;
- add the file (you can add more than one by repeating steps 1 and 2);
- indicate the dimensions of the single pixel. I entered 1x1 because it is the files I used have a pitch of 1m, i.e. the contiguous points are 1m apart; in practice all of this which is more smaller than 1m is not been "read" by the scanner. Now click on OK and the following will appear. the following:
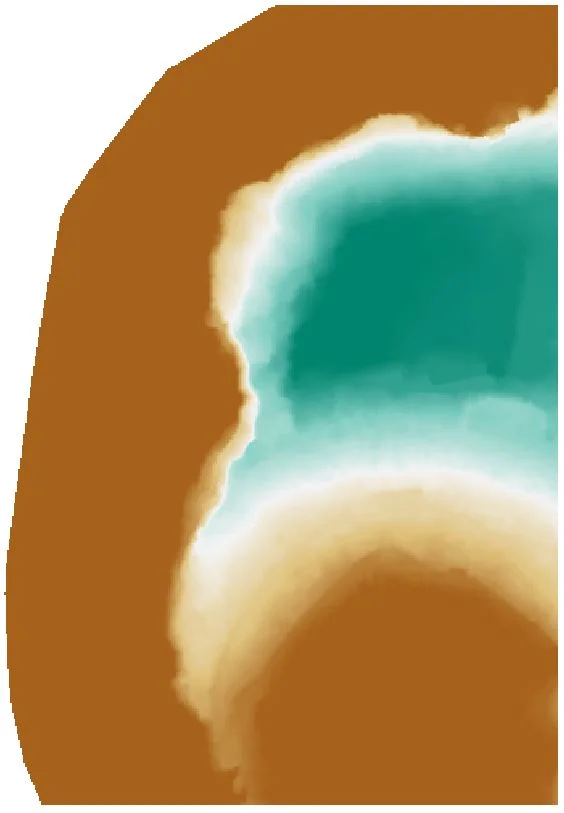
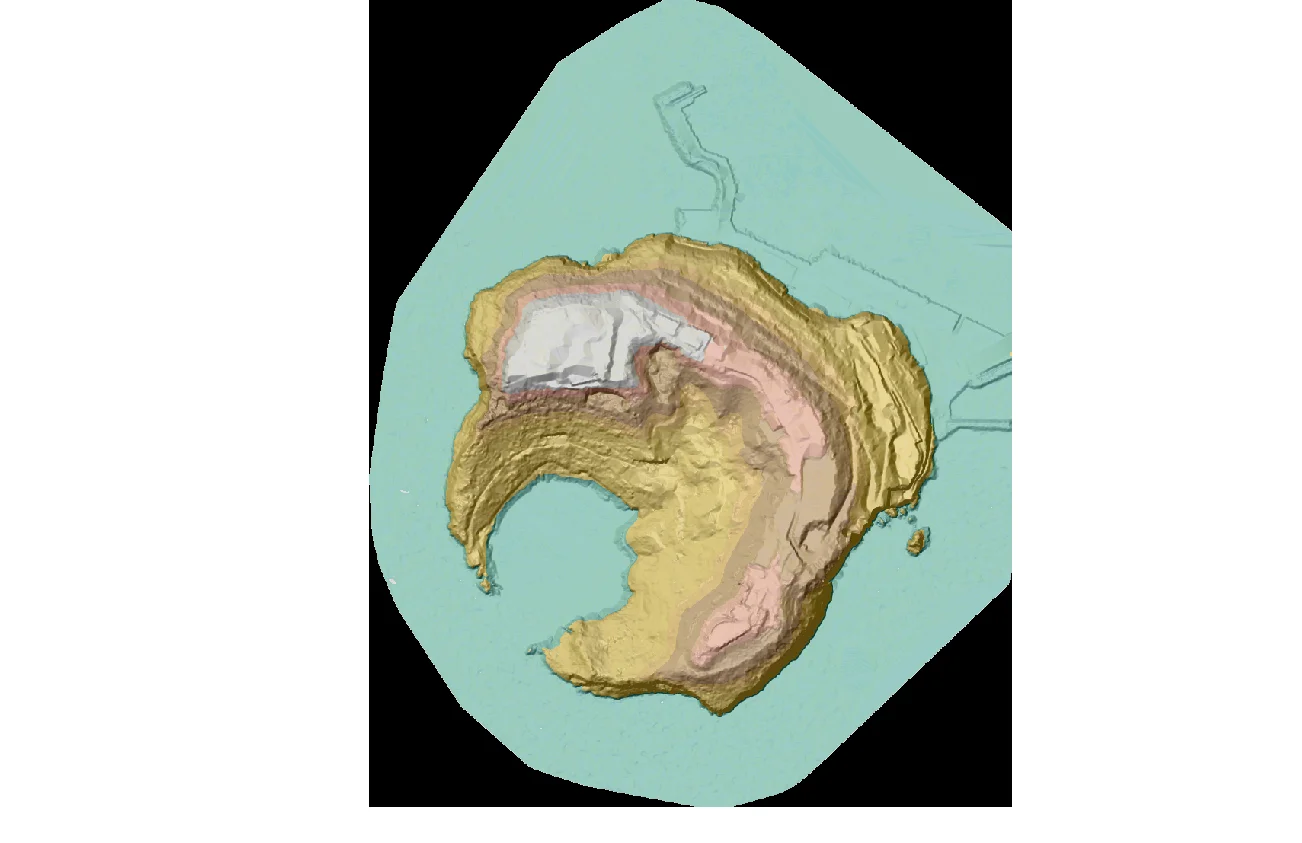
This is a portion of Nisida appropriately themed, now combine all the LiDARs to obtain the following:
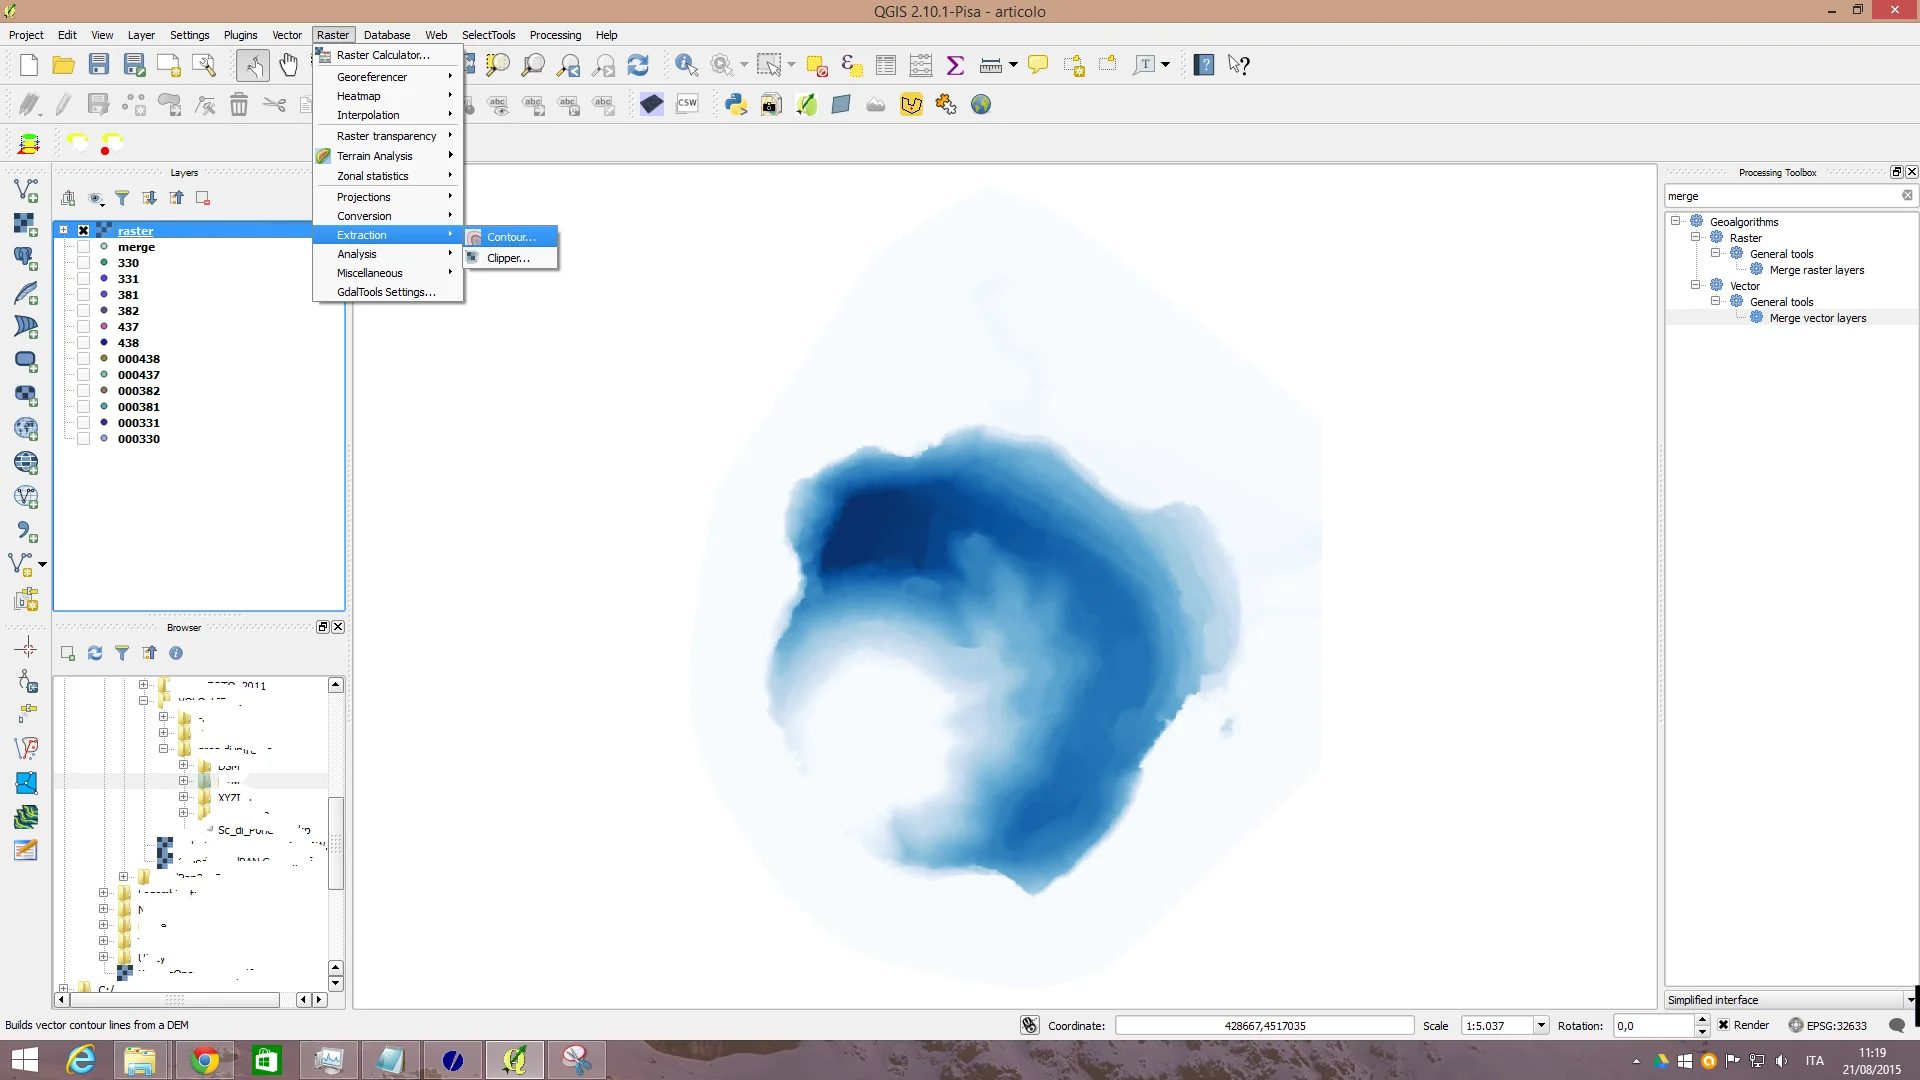
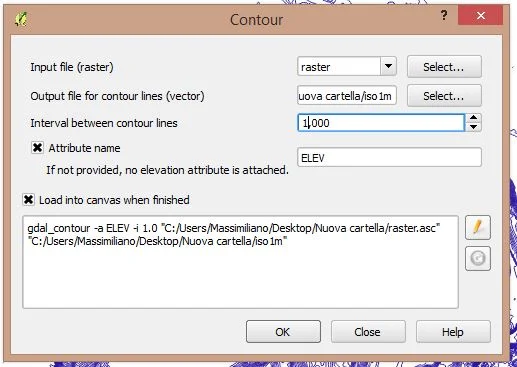
Now let's try to extract the contour lines. Go to Raster>Extraction>Countour, define the folder in which to save the shape and enter the distance between the curves, 1m in this case, check Attribute name and click OK.
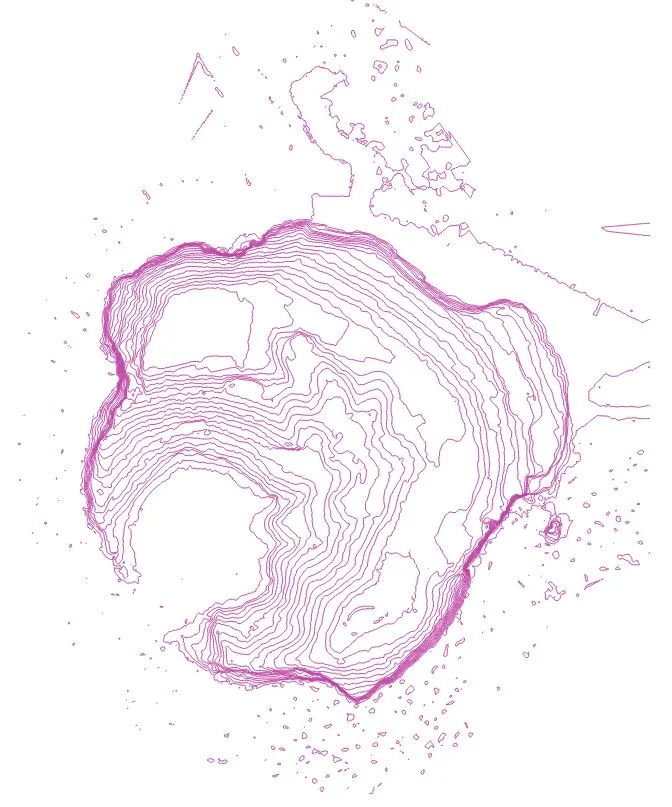
You will get a file like this:

As you can see the file appears to be a little "dirty" at sea, this is due to some scanner errors caused by the refraction of the waves or, as you will notice, in some cases the outlines of the boats are present.
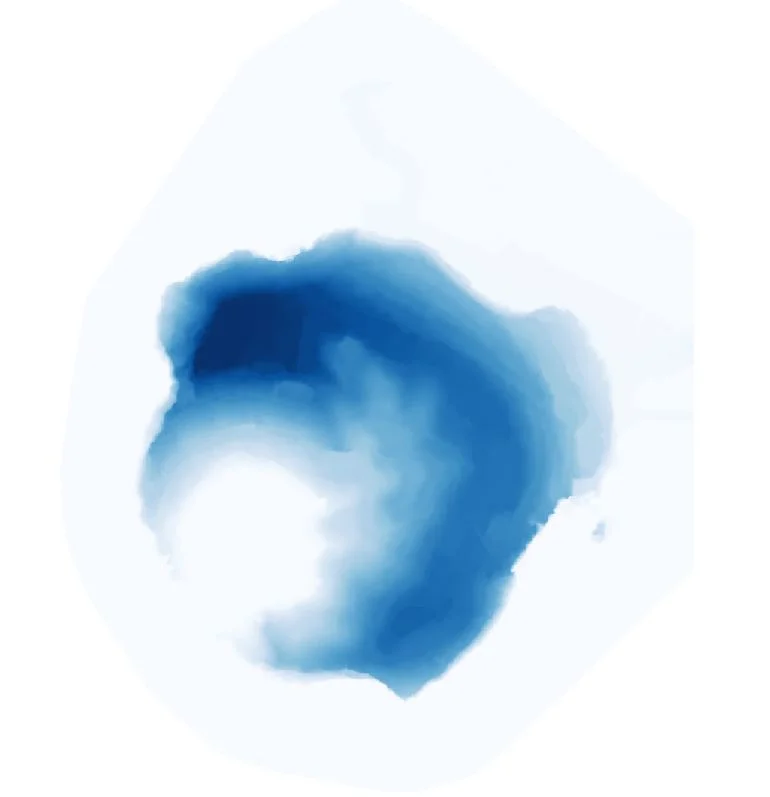
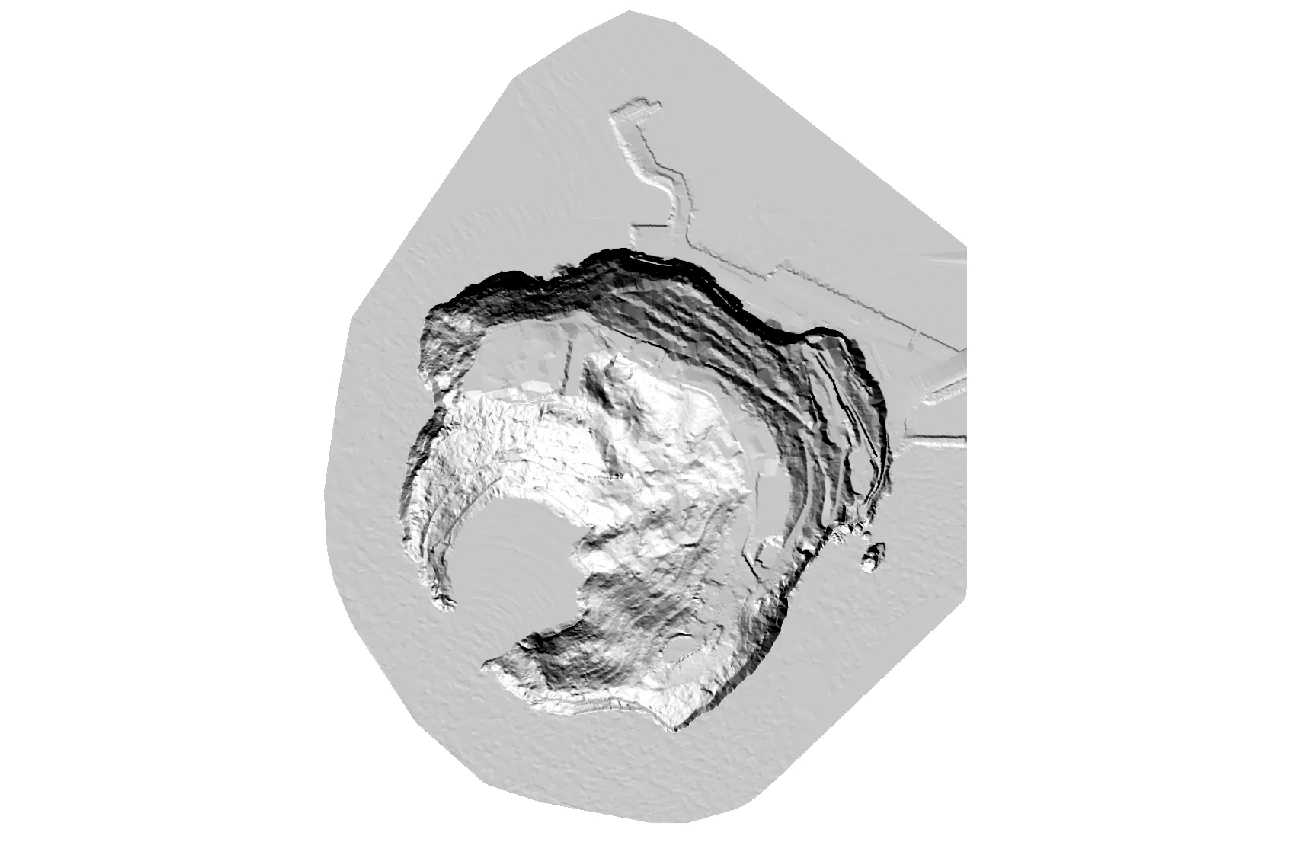
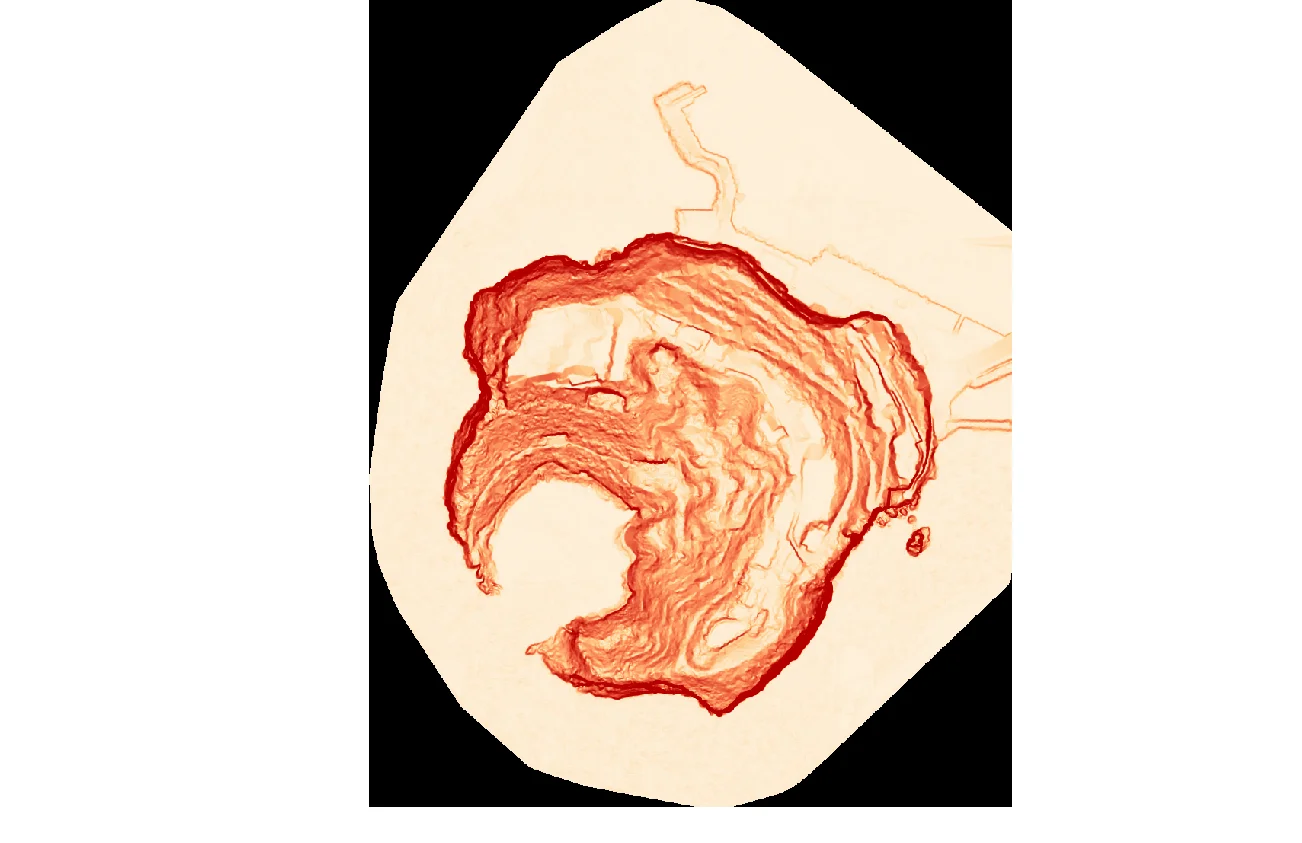
If you want you can have fun obtaining isoipses at greater distances or you can indulge yourself with the various QGis raster processing tools, below are some of the processing I did:
NB: the LiDAR data used in this article can be freely downloaded from the City's SIT Naples Metro, section OpenData. The files, originally in grid format, were converted into point cloud for educational purposes and to make them as user-friendly as possible. similar as possible to the output of a LiDAR instrumentation.