
In my previous life as a salesperson for a company that sells photovoltaic systems, I always wondered if and how it was possible to carry out a rapid survey of an area of interest to identify which roofs were most suitable. suitable for the installation of a photovoltaic system and estimate its potential in kWp.
Today, a few years after that experience, I have finally found some time to write this article in which, with the GIS methodology, I hope to lend a good hand to my former commercial colleagues ;)
What we need is:
- a polygonal vector that reproduces the buildings of the area of interest;
- a DSM from LiDAR or in any case with a resolution not exceeding 1 m;
- skills in spatial analysis.
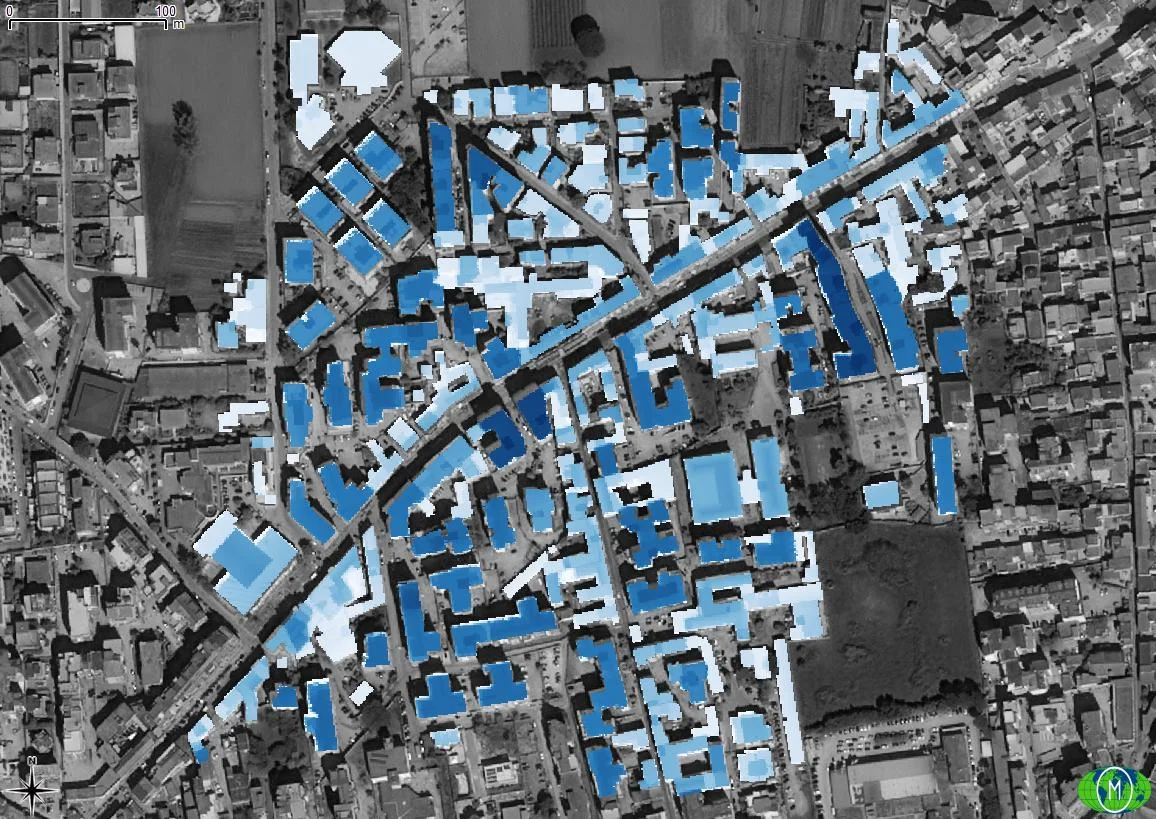
Let's start by making a clip of our raster using the building as a clip polygon. By theming the DEM you just obtained you should have something similar to what you see below. The choice of colors is arbitrary; as the intensity varies of blue increases the height of the building.
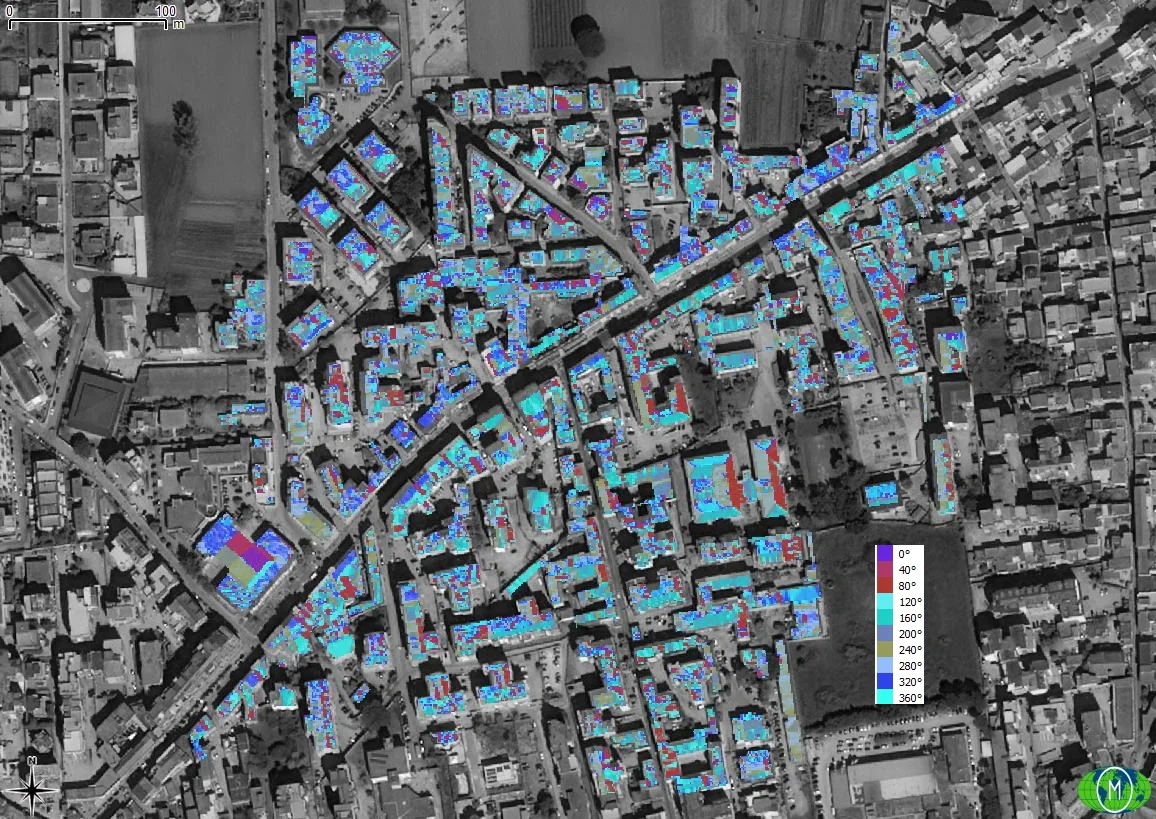
Taking a look at the slopes we could already get an initial idea of which roof is the right one? suitable and which is not. We extract the slopes with slope from the Processing Toolbox of QGIS; also in this case the thematization is to your taste.

NB: the slopes refer to the cartographic plane! So 0° refer to a flat roof, with 85.8° of slope we have an almost vertical roof (and orthogonal to the cartographic plane)!
Certainly a roof at almost 90°, in our latitudes, is not the most suitable for the installation of a photovoltaic system!
Let's start extracting only the flat roofs. To do this we must carry out these three operations in sequence:
- Reclassification of the slope raster;
- Generating a vector from the newly reclassified raster;
- Selection and saving of only the polygons that fall within the class of interest.
To reclassify our slope raster we will use the geoalgorithm r.reclass by GRASS GIS searchable from the Processing Toolbox. It is important the correct definition of classes!
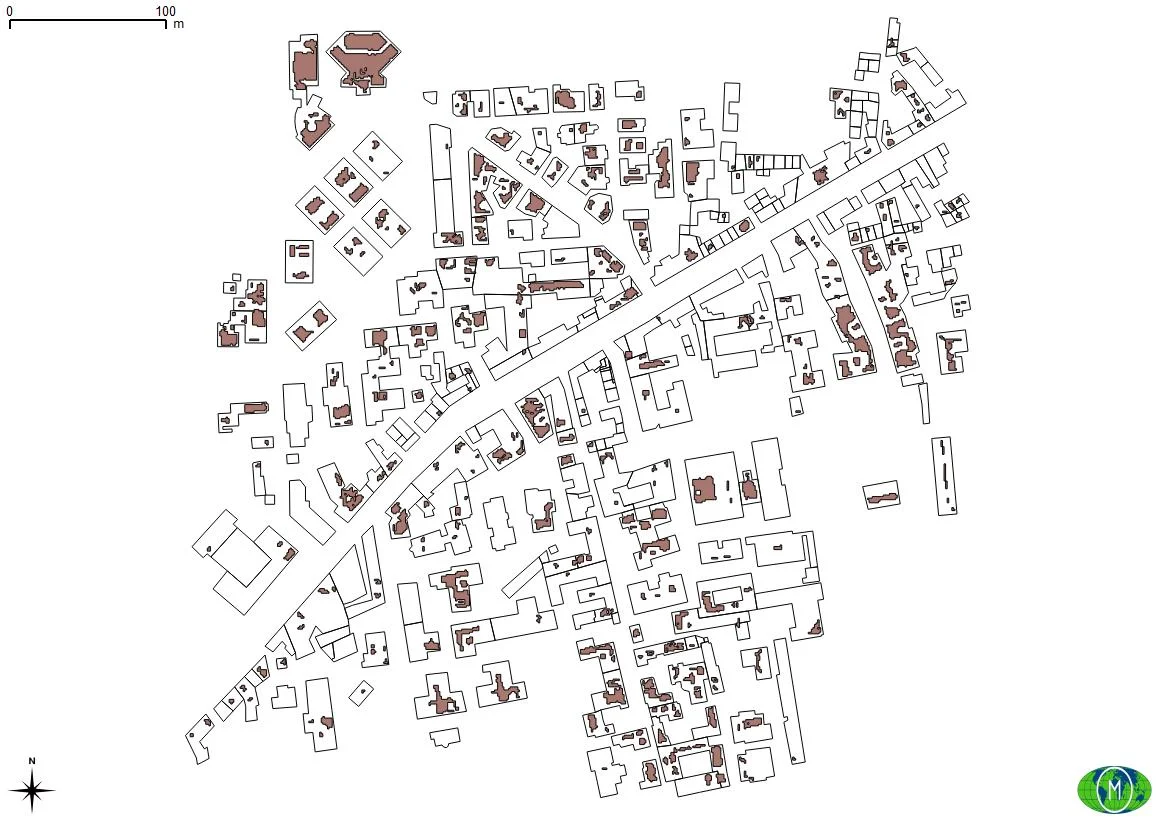
I divided the slopes into two classes: greater than 3° and less than 3°. All roofs with a maximum slope of 3° I considered them flat and it's true. This is the class that interests us at this stage. At the end of the reclassification I converted the raster classes into polygons using Polygonize again from the Processing Toolbox. On the polygonal vector like this Once I obtained it, I carried out a query to extract only the roofs that fall into the category of our interest.
Here's the result! Do it too, it seems difficult but it's not!
Let us now return to thinking about our DEM clipped at the beginning of the article. Yes, we have slopes but we are also interested in exposure. A sloping roof exposed to the SOUTH is the solution that most we hope but how do we identify it? Now we'll see how to do it!
We reclassify the result of the previous geoalgorithm in order to obtain the exposure classes of our interest.
NB: I advise you to carefully read the content in the link I inserted previously in Aspect!
For simplicity and speed I created three exposure classes: NORTH-EAST, EAST-SOUTH-WEST and WEST-NORTH. The one that interests us is EAST-SOUTH-WEST. We convert the raster into polygons and by making a selection of only the polygons of interest, we will save the selection as follows. as done for the identification of flat roofs.
The result is what follows and there is also a little gem that confirms the method used ;)
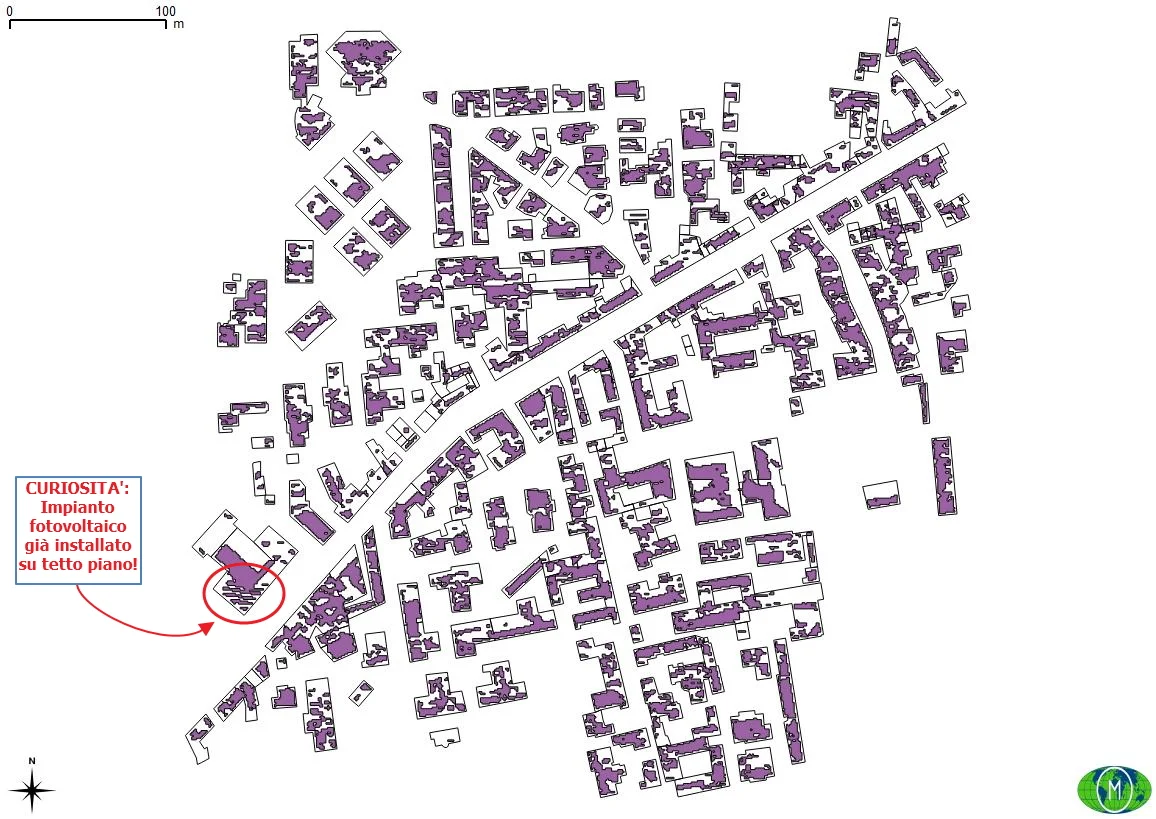
Check out the curiosity here!
We perform a Union between the two vectors just created (post selection!) and eliminate any anomalies such as roofs that can be simultaneously flat and inclined. These anomalies may exist because the operations we have carried out depend on the resolution of the DSM on which we have operated from the beginning. More we go below the resolution meter, the fewer errors we would have!
Now we activate the Field Calculator, in the attribute table of the Union output vector, and clean all areas smaller than 7 m2. I used this parameter because it is approximately 1 kWp covers 7 m2. Obviously to do this cleaning we must calculate the areas of the individual polygons in advance!
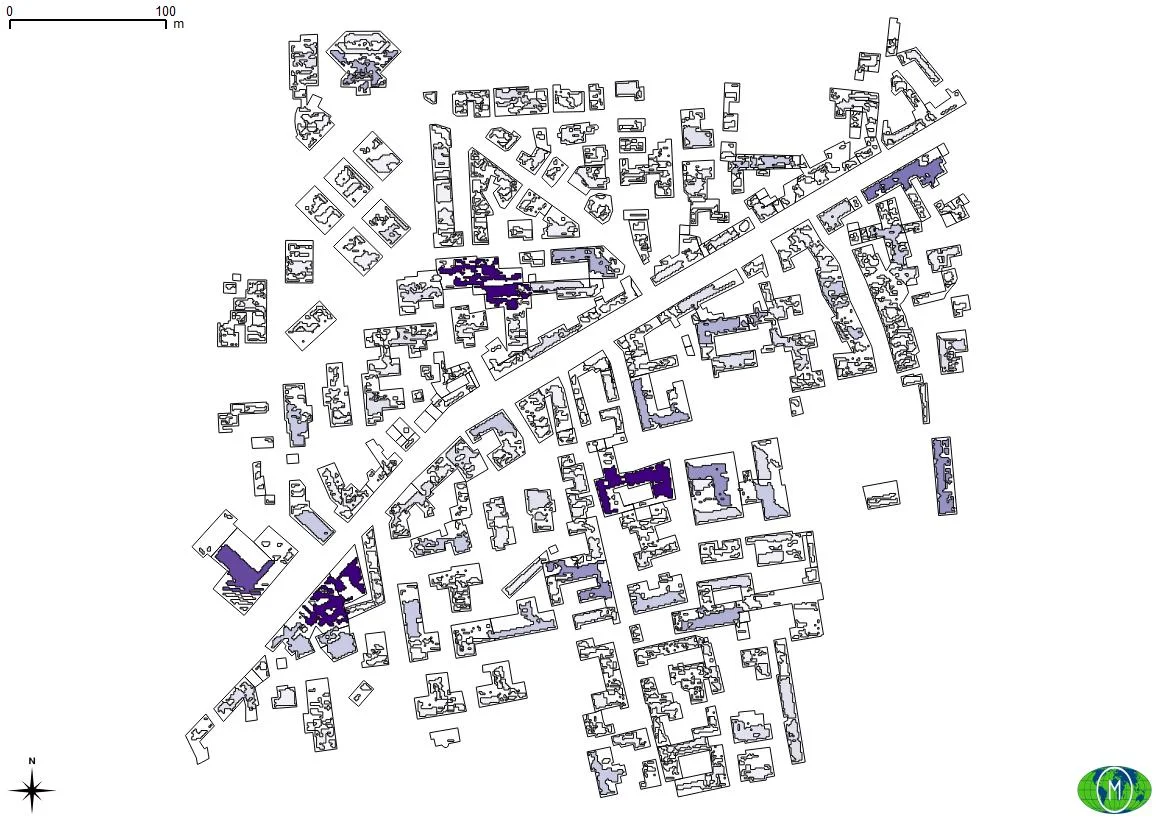
We are at the end of our search! In the previous image we can see the vector of the buildings and that of the potentially useful roofs. As the purple intensifies we have greater electricity production. Therefore, of the many buildings present in this 25 Ha area, we can see that only 3-4 have a high energy production (we are between 70 and 90 kWp) while the others have a low production.
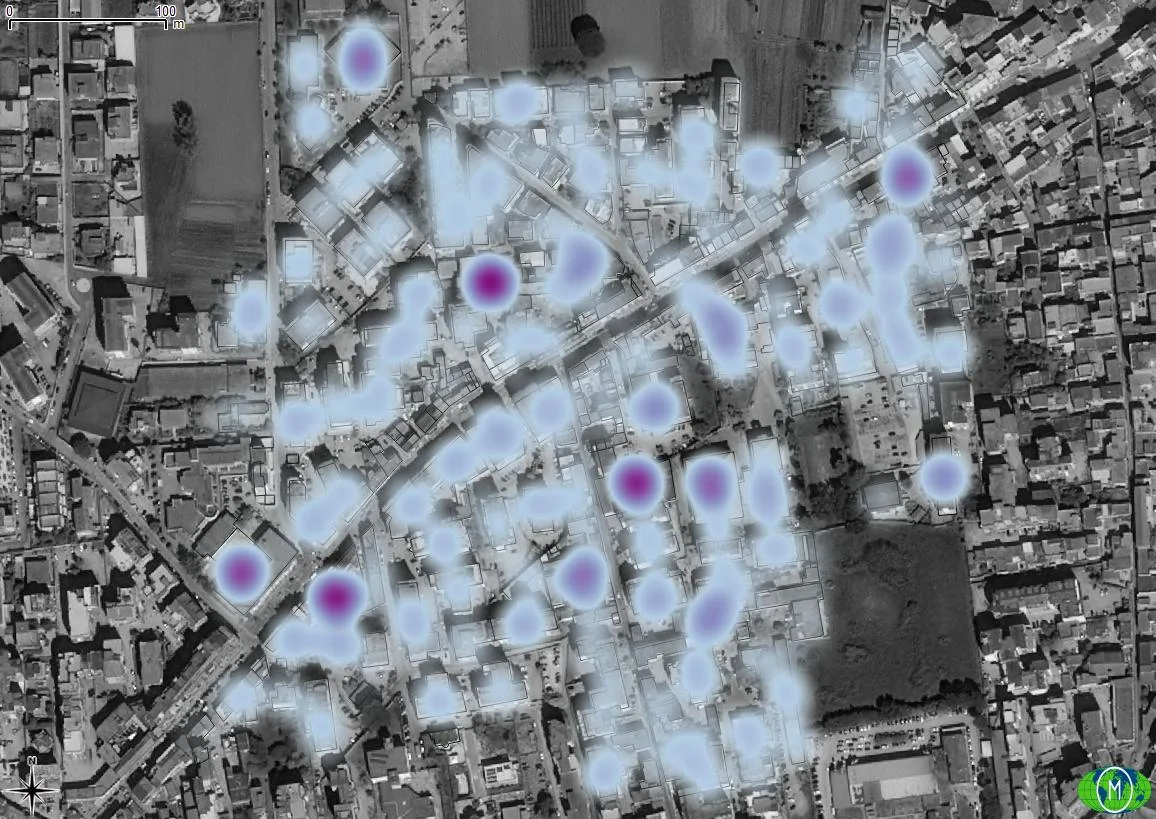
The heat map also highlights where the potential targets are!
It is possible to refine the research? Yes! For example, taking a step back from the Aspect and extracting useful roof slopes, discarding the others, and then determining the exposure on the latter.
Try it yourself! ;)
Python
Are you familiar with Python? See how to get the same solved with this JupyterNotebook :)