
Last 2 February ISTAT published the provisional data of the complete population census for the year 2021. These are the data linked to the census cells which are updated every ten years starting from 1991 and which ISTAT calls "TERRITORIAL BASES AND CENSUS VARIABLES".
In the wake of this excellent news I decided to resume work on the Python package that I was developing and that I will use (but I hope I'm not the only one!) to automatically download the census data and to do an initial preprocessing of it. Currently the library is in pre-release version 0.2.2 and you can find it here.
With this article I want to reflect with you on the trend of the "inhabited center" parameter surveyed by ISTAT since 1991. According to our statistical institute, inhabited centers are:
Aggregate of contiguous or nearby houses with interposed streets, squares and the like, or in any case short solutions of continuity characterized by the existence of public services or businesses (school, public office, pharmacy, shop or similar) which constitute an autonomous form of social life and, generally, also a gathering place for the inhabitants of the surrounding areas in order to demonstrate the existence of a form of social life coordinated by the center itself.
Extracting this data from the census cells is It is possible to go and check the extension of the inhabited center and compare it with the same for the following census years. To tell the truth there are also other parameters in the "LOC_TYPE" column from which I extracted the inhabited centers: inhabited nucleus, scattered houses and since 2001 also localities. productive; I wanted to concentrate for the moment only on inhabited centres.
By aggregating the data at a regional scale, the result is the following.
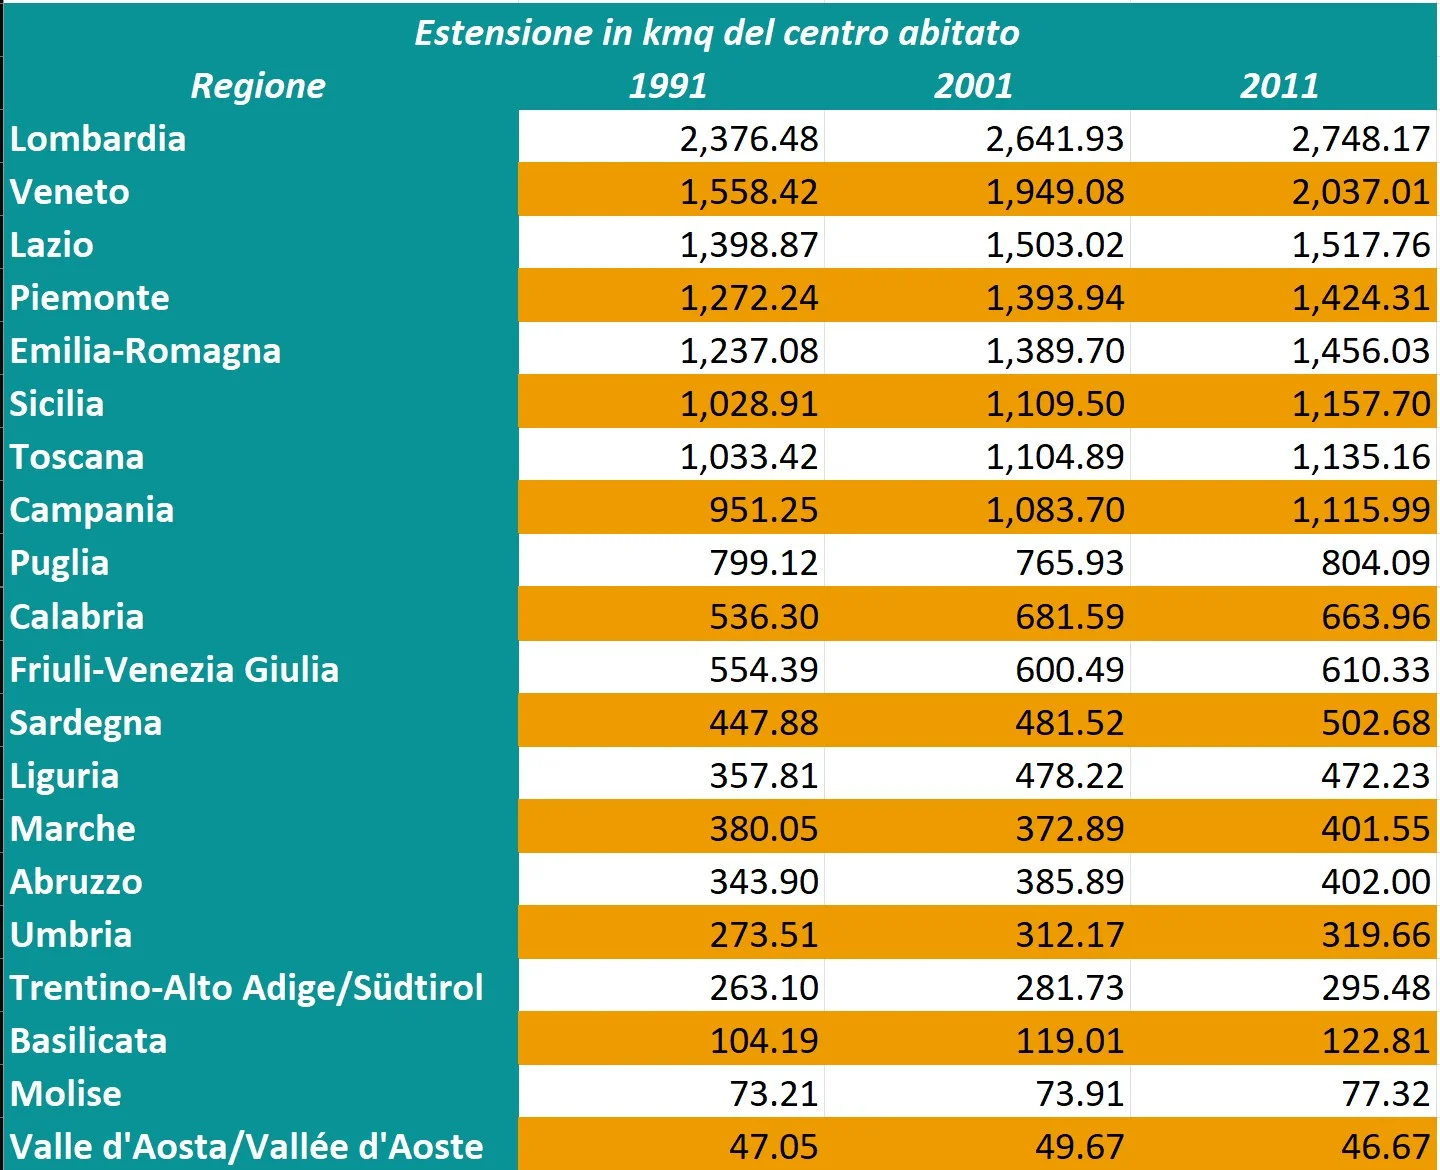
I have ordered the data by decreasing trend compared to 2011, it is noted that in almost all Italian regions there is the inhabited center has increased, even substantially, and therefore the waterproofing of the soil. It is worth remembering that we live in a hydrogeologically fragile country. From what I see, the increases have occurred precisely in those regions that are at greatest risk and which, not even on purpose, I spoke about almost a year ago in the article "The areas at greatest risk of flooding in Italy".
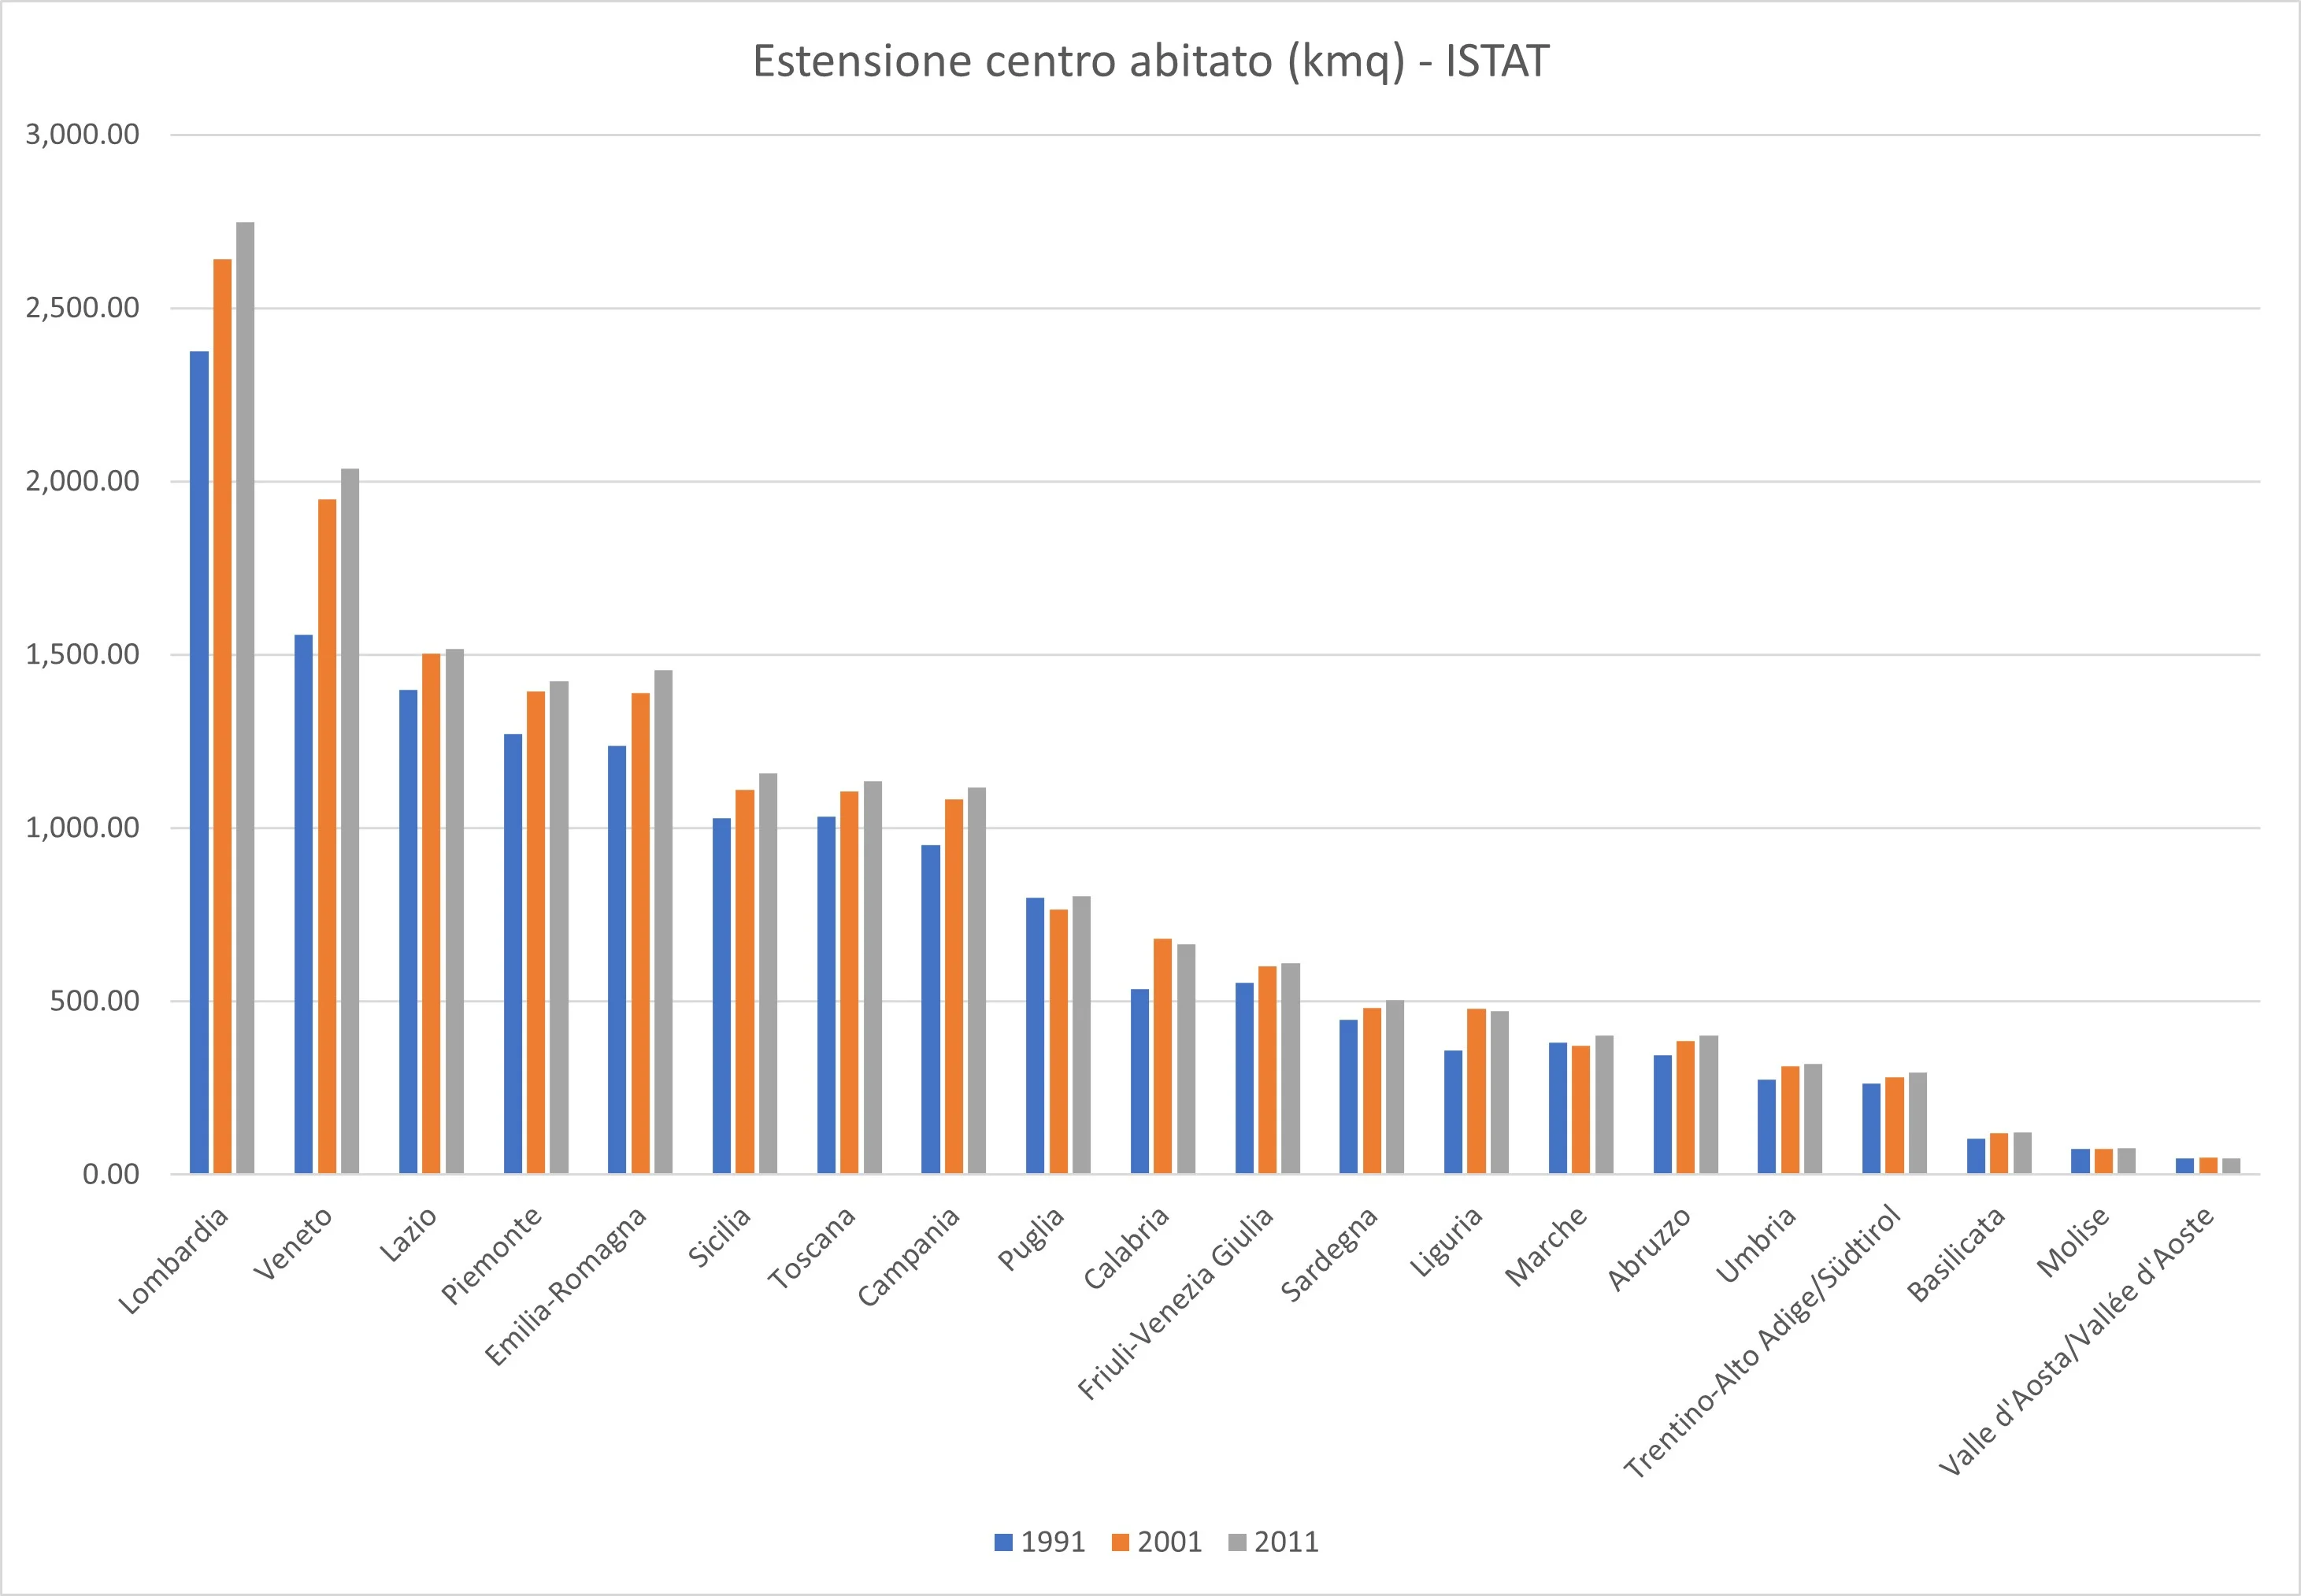
If we look at the graph comparing the years we have an evidently merciless picture.
If we take into consideration the regional capitals of the five regions with the greatest flood risk that I spoke about in the article I indicated previously, the situation is not not positive at all.
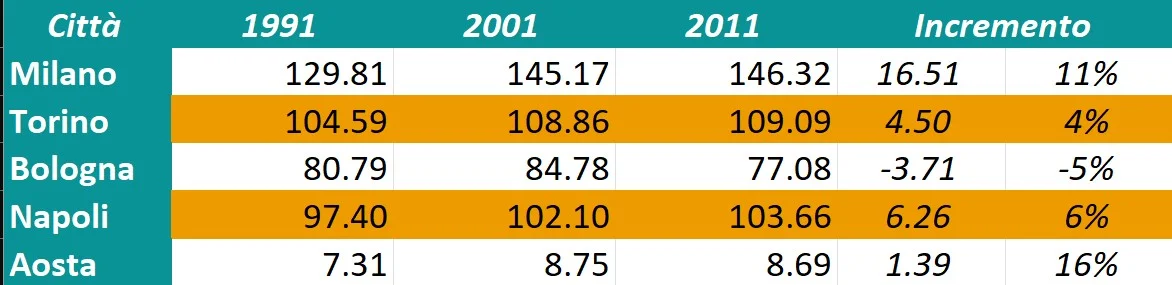
The data in the table is always in square kilometers and the increase, both net and percentage, is relating to the comparison between 1991 and 2011.
To give a more idea clear, 1 football field is approximately one hectare, 1 square kilometer is equal to one hundred hectares, therefore approximately 100 football fields. In Milan it is therefore as if 1,600 football fields were built from 1991 to 2011.
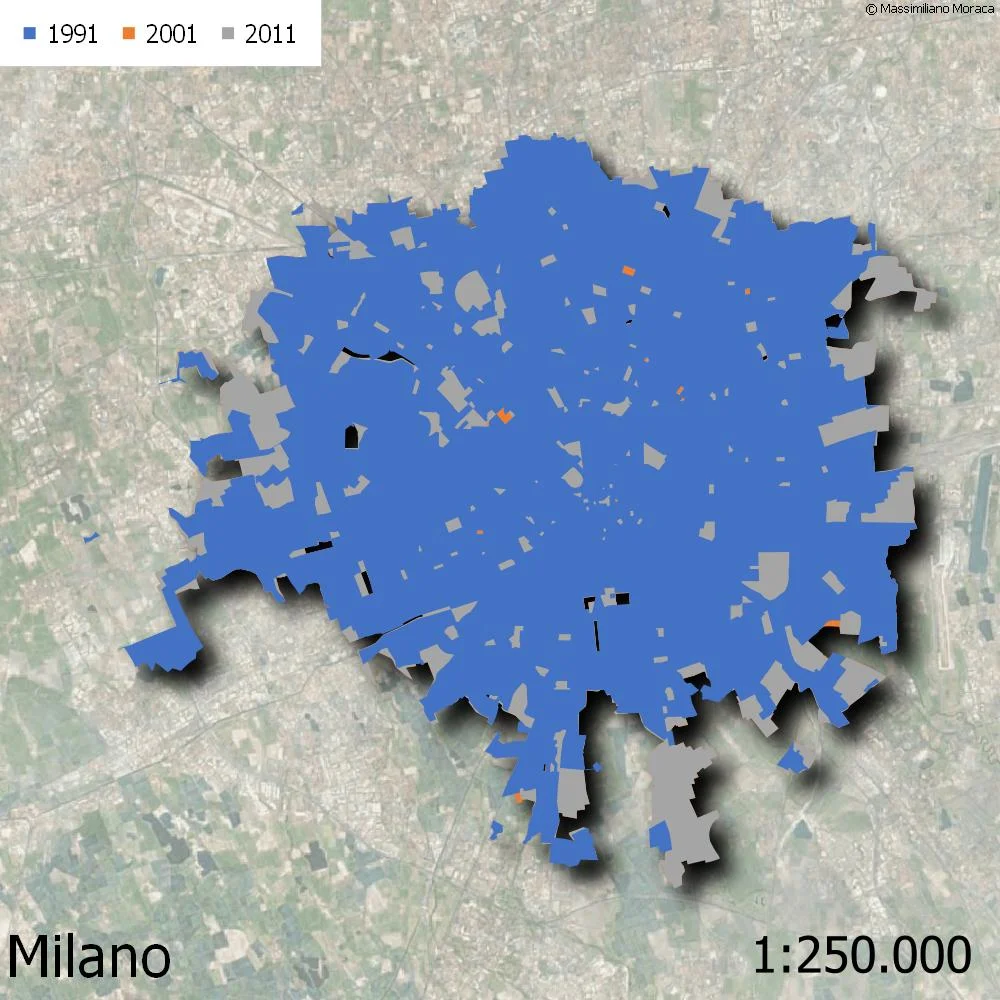
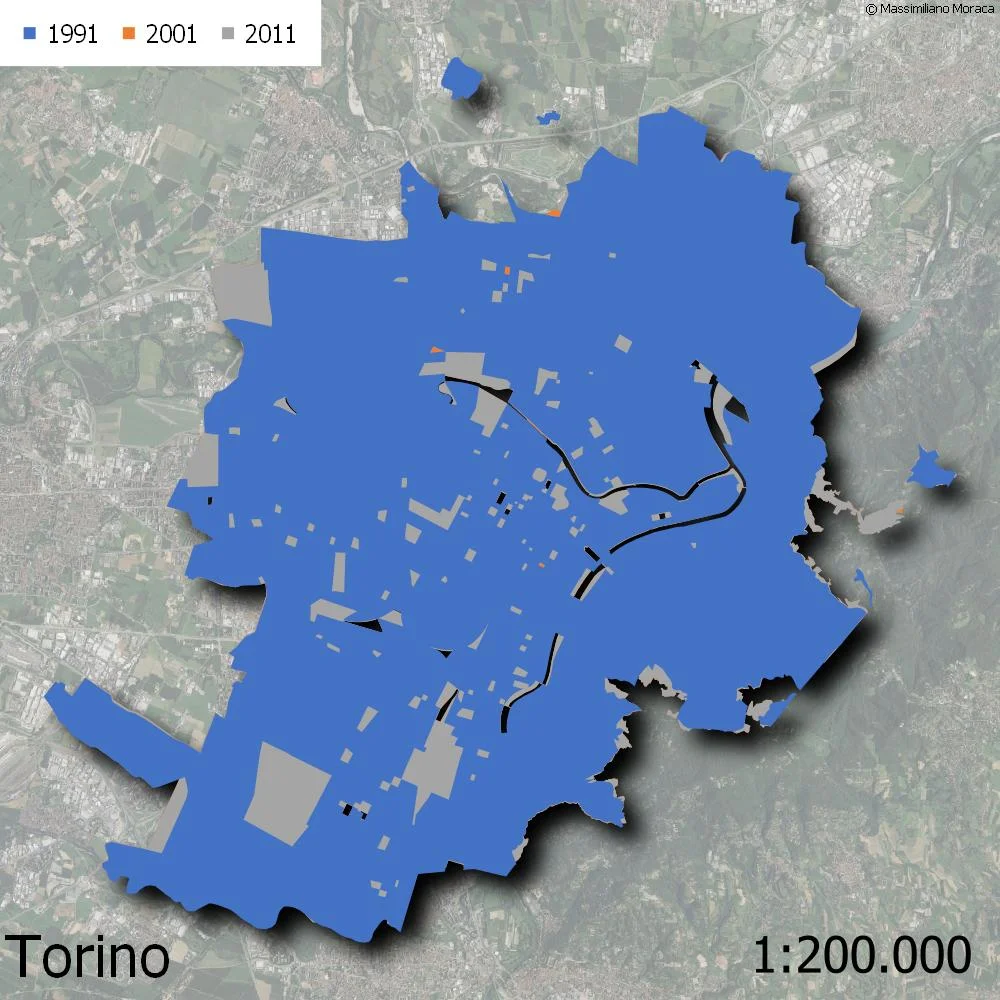
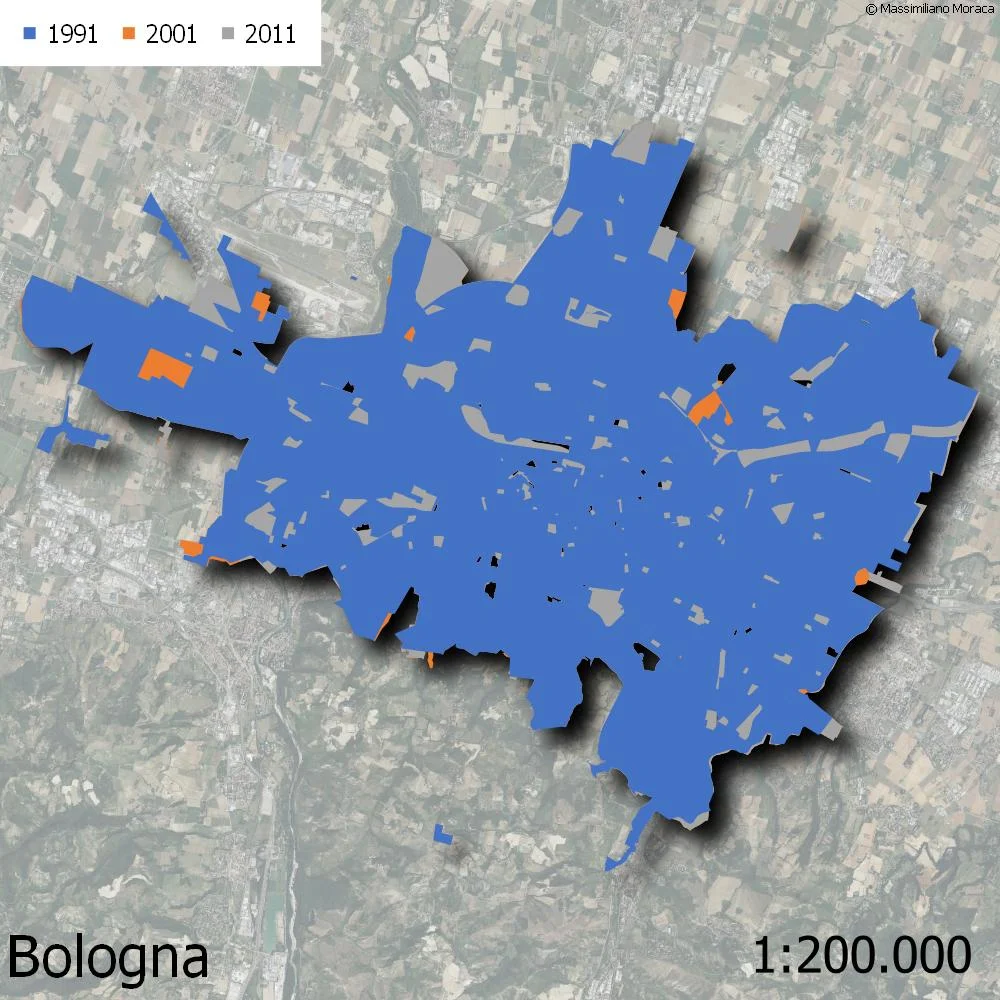
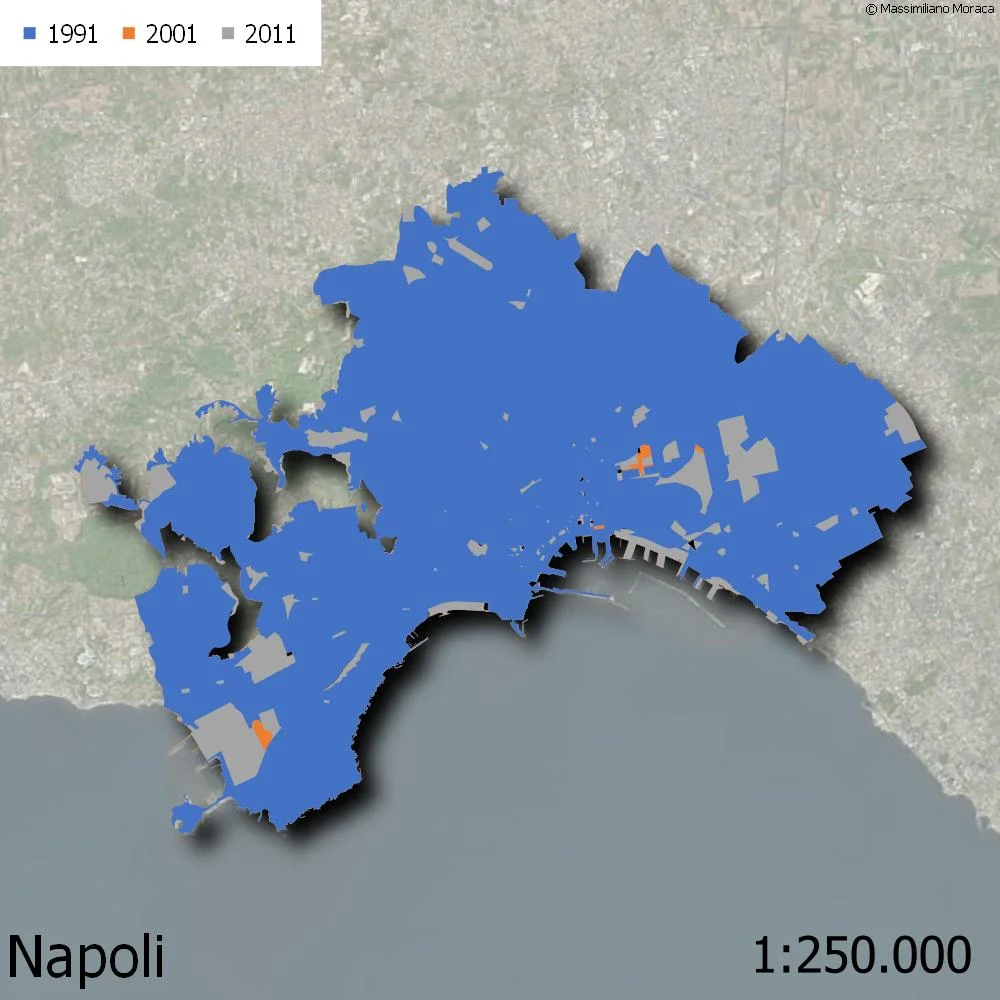
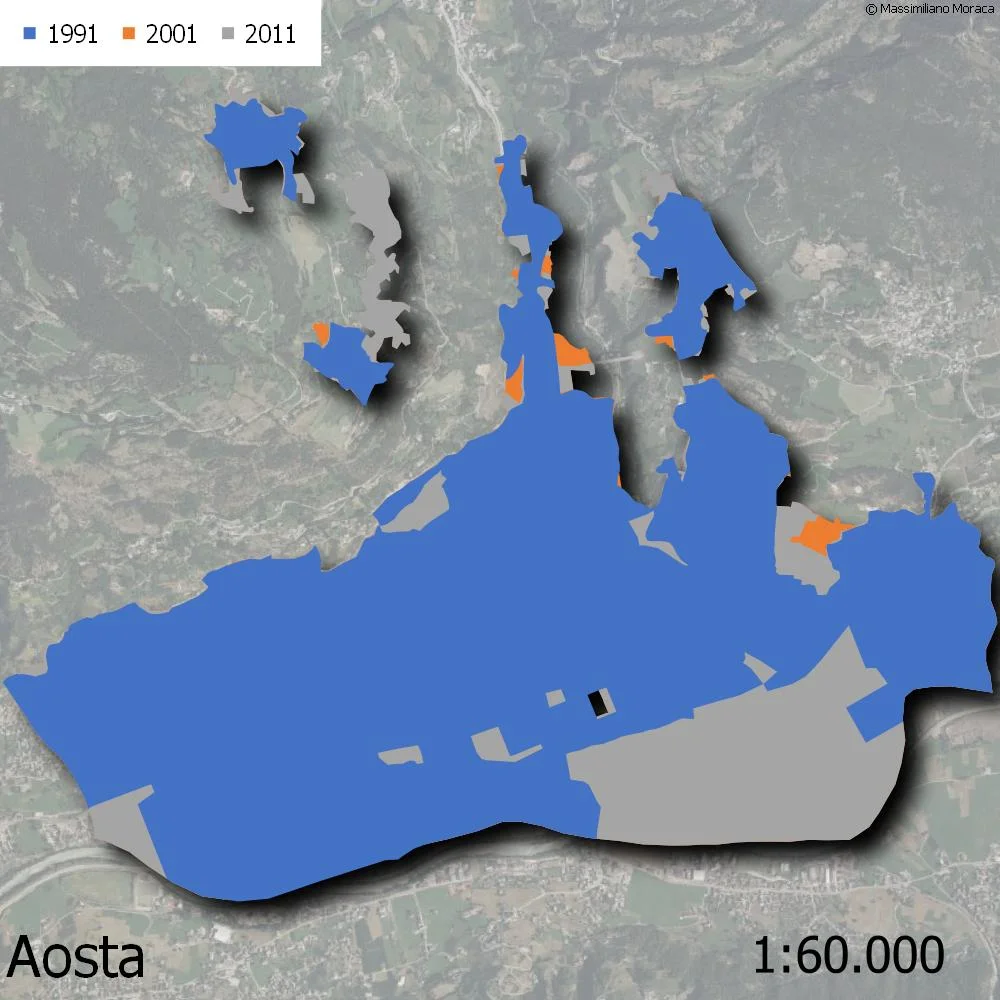
Consistent with the colors of the previous graph, in the following images, in blue is the area relating to 1991 is visible, the increases for 2001 are in orange and those for 2011 are in grey.
Once the data has been exposed, the question that is running through my head and which I don't know if I will understand The answer is: has the increase in urban surface area in these cities, but it applies to the entire Italian territory, led in parallel to an increase in services to citizens not only in number but also in quality?