
Is it possible to create a 3D reproduction of an area without spending 1 euro? The answer is yes and I'll show it to you with this tutorial!
Necessary things:
- familiarity with the GIS methodology;
- familiarity with QGIS;
- application;
- a little patience ;)
Let's get started!
We recover a CTR, a DTM and a DSM. For this tutorial I used the 1:1000 CTR downloaded in the Open Data section of the Municipality of Naples website; for the two DEMs I drew on the Open Data section of the City's SIT. Naples Metro. Some time ago I already told you showed the potential dei DEM from LiDAR.
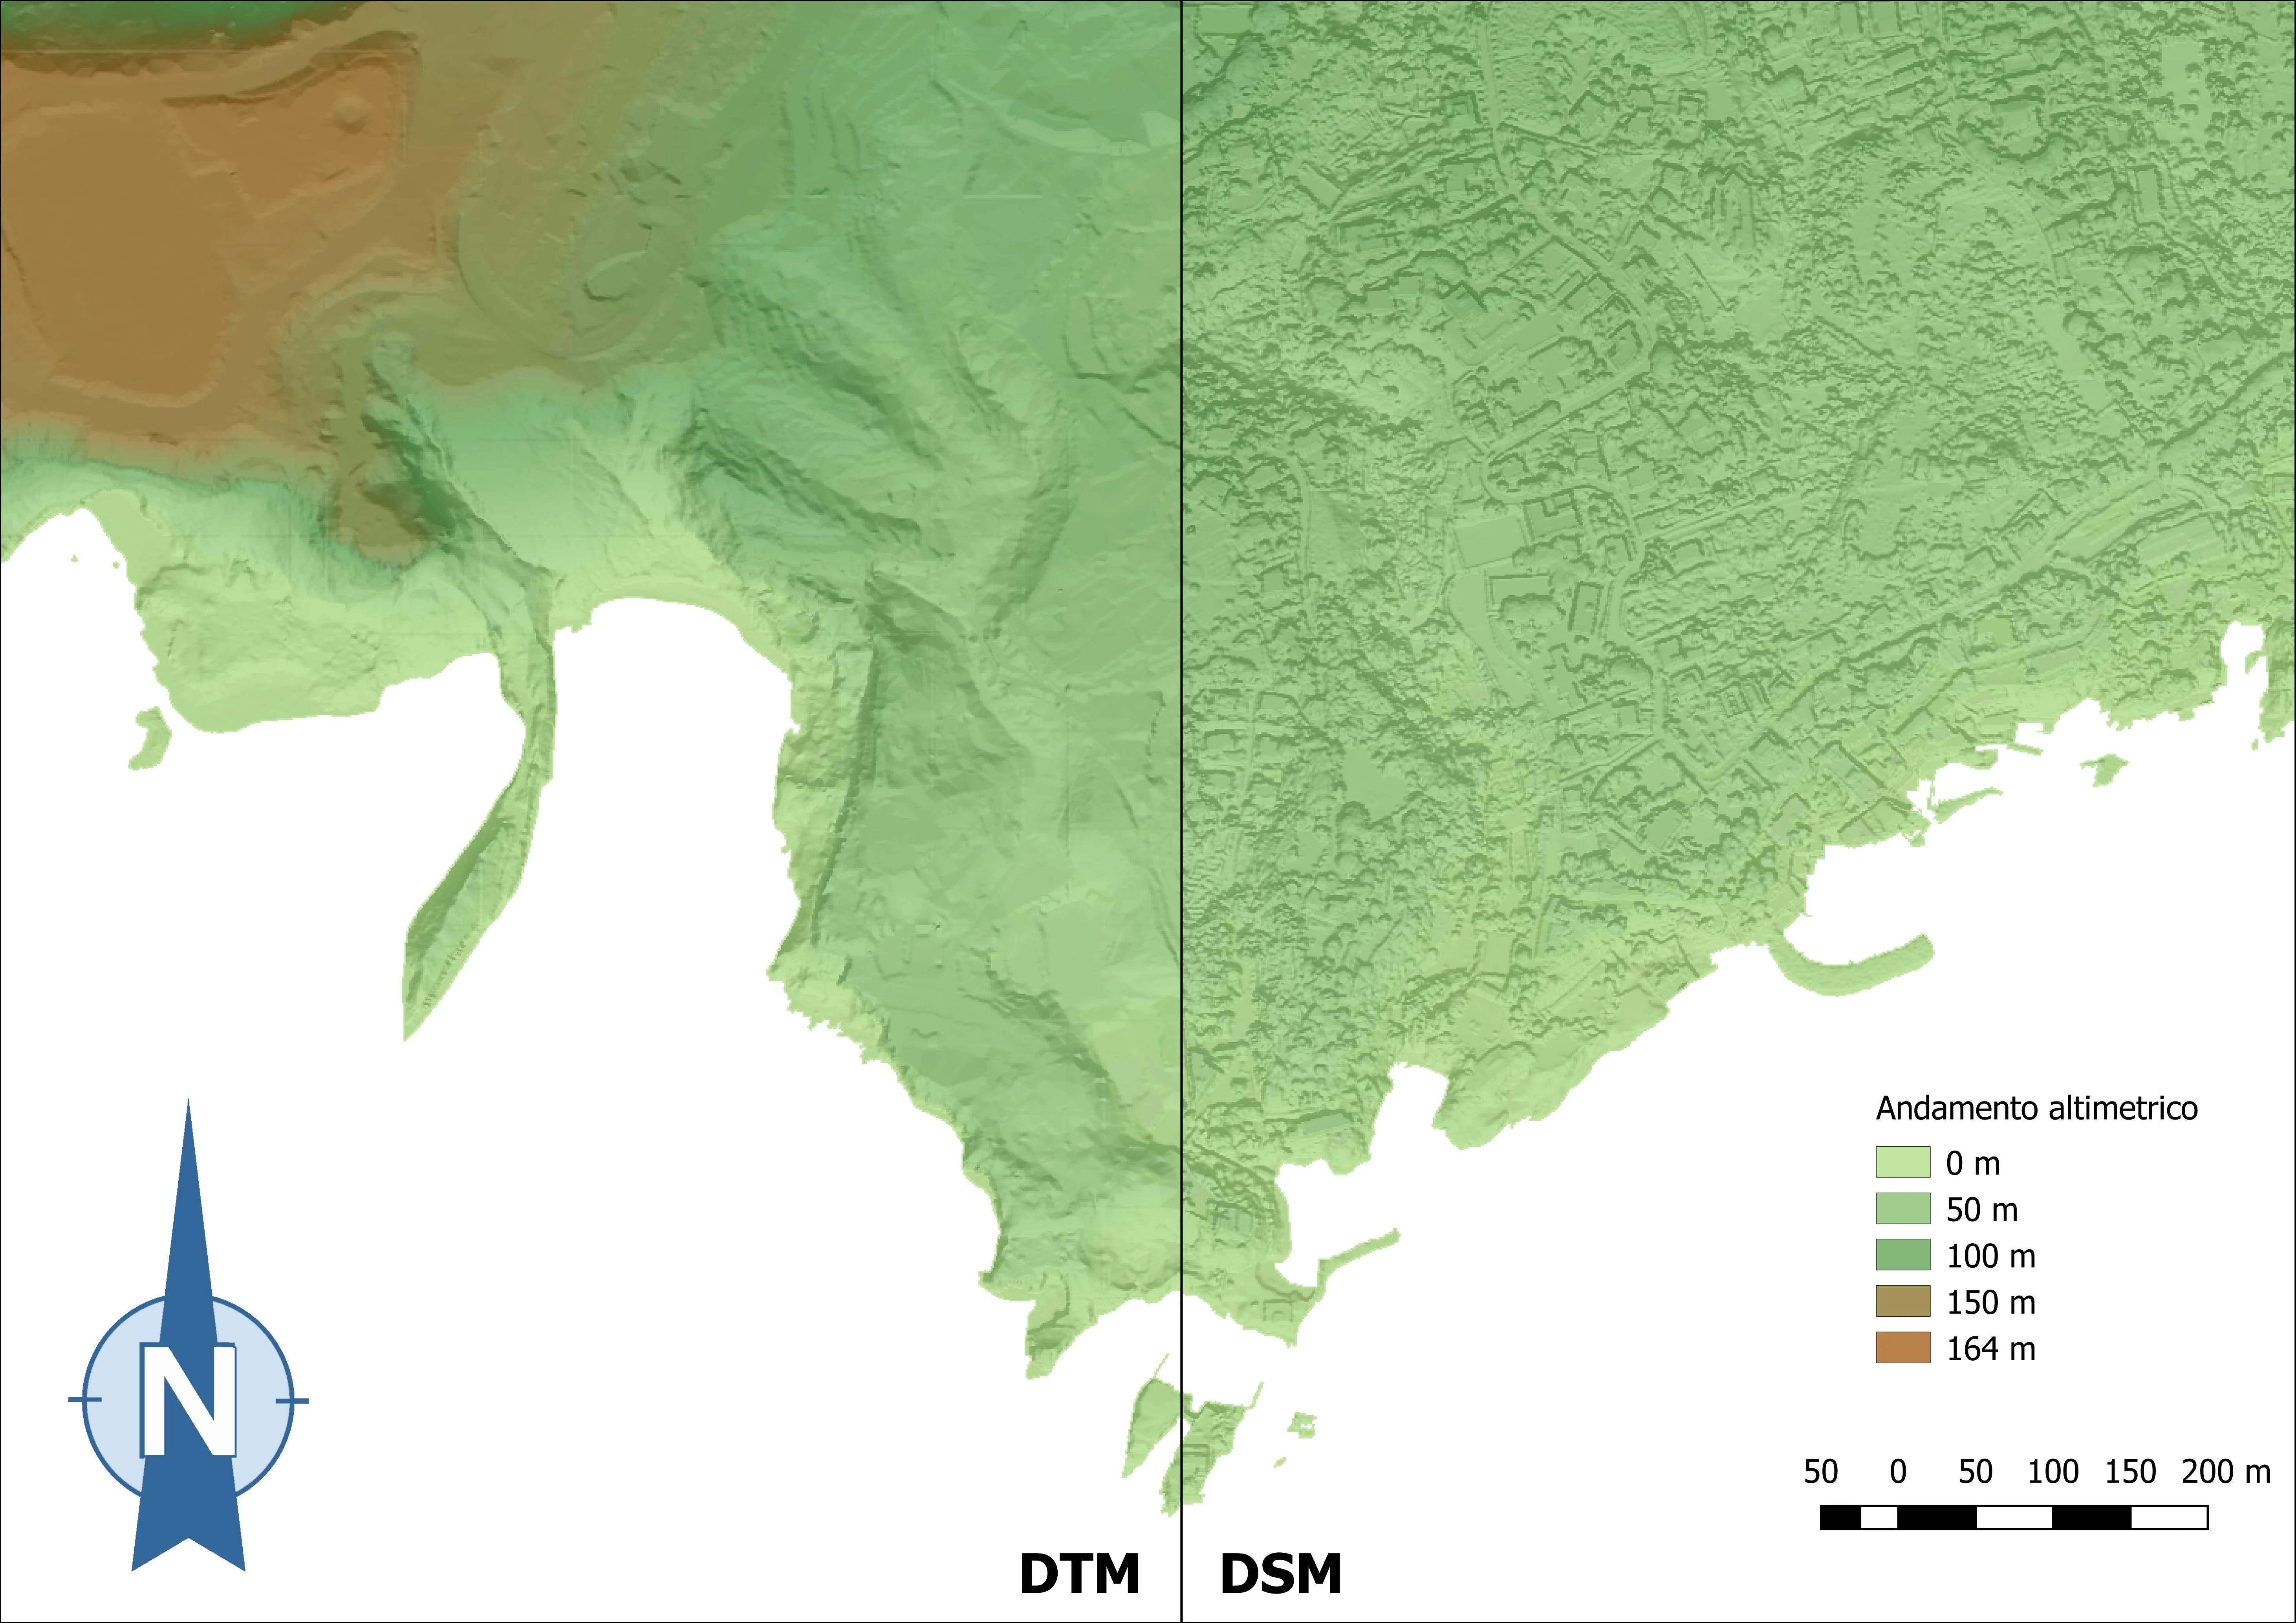
Let's work on DEMs first. As you know DEM is the acronym for Digital Elevation Model or Digital Elevation Model; the DTM - Digital Terrain Model - and the DSM - Digital Surface Model belong to the DEM family. In the DTM it is the morphology of the places is reported net of buildings and vegetation; while in the DSM it is reported the real surface of an area including, therefore, the buildings and the vegetative cover.
Opening the Raster Calculator let's calculate the difference between our two DEMs as follows.
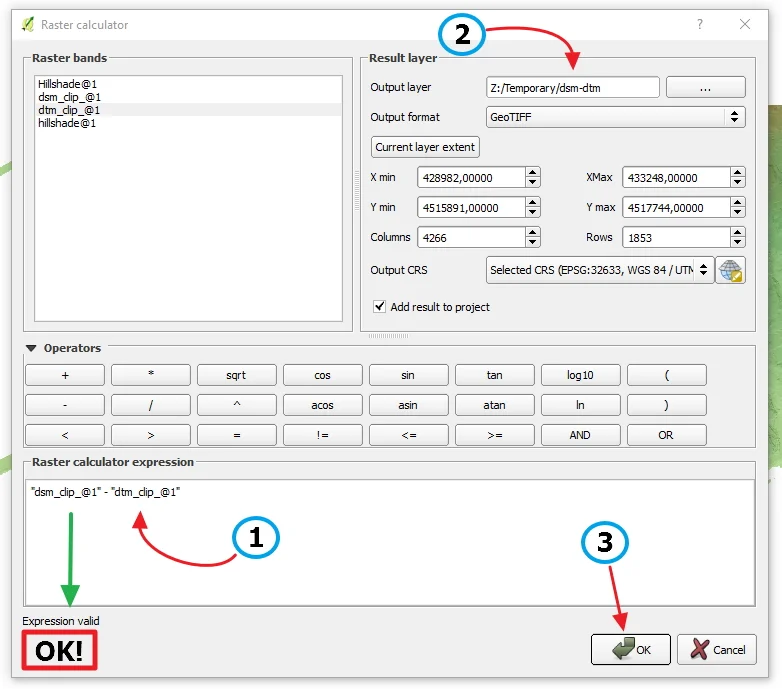
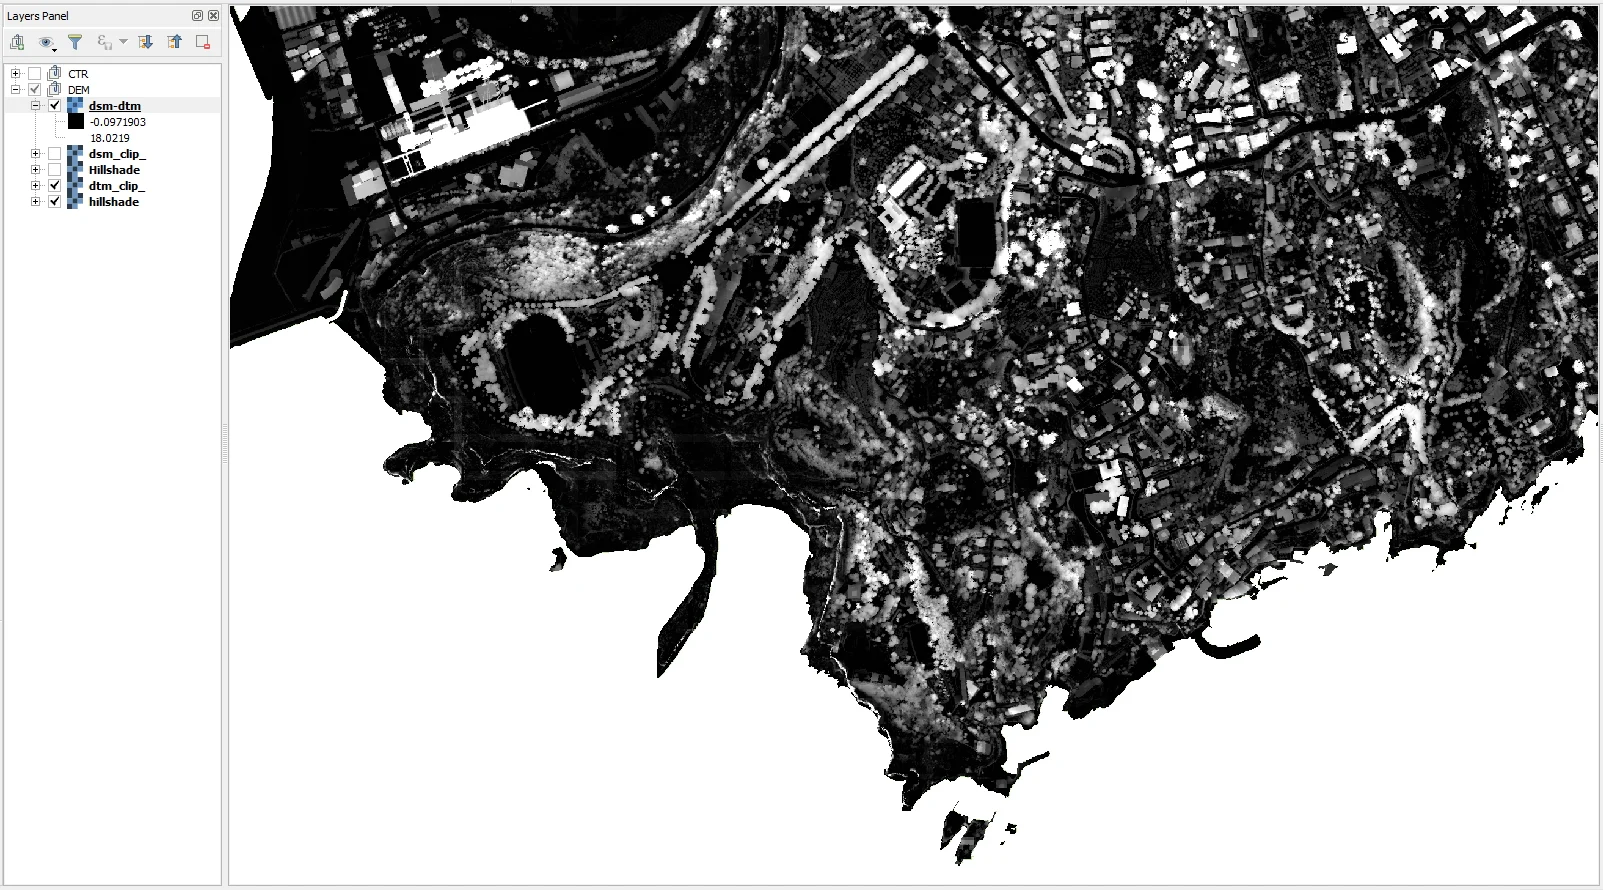
We thus have obtained a difference raster, a DEM, which includes only the heights of buildings and vegetation; it is not therefore the earth's surface is present.
Now let's go work on the CTR. The first step is to merge the files we have available which, in this case, are composed of two shapefiles: one for the Municipality; 1 and the other for the Municipality 10.

From the union and through select operations we extract the coastline and the buildings. We then use the lines to polygons tool to polygonalize the building.
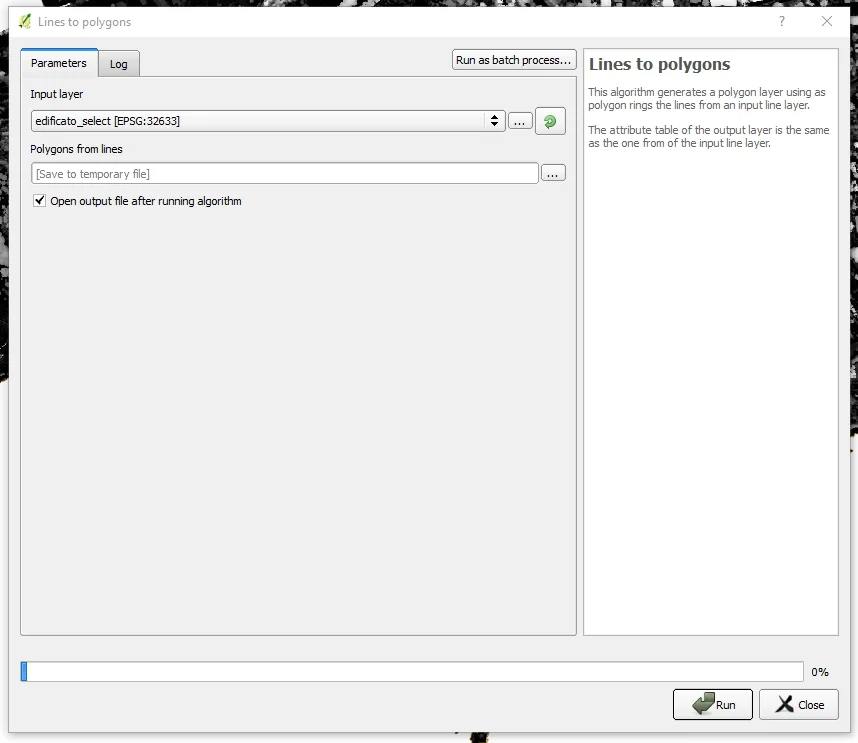
The result will be the following, in which I omitted the operations necessary to correct the topology of the lines so that polygons useful for our purpose were obtained.

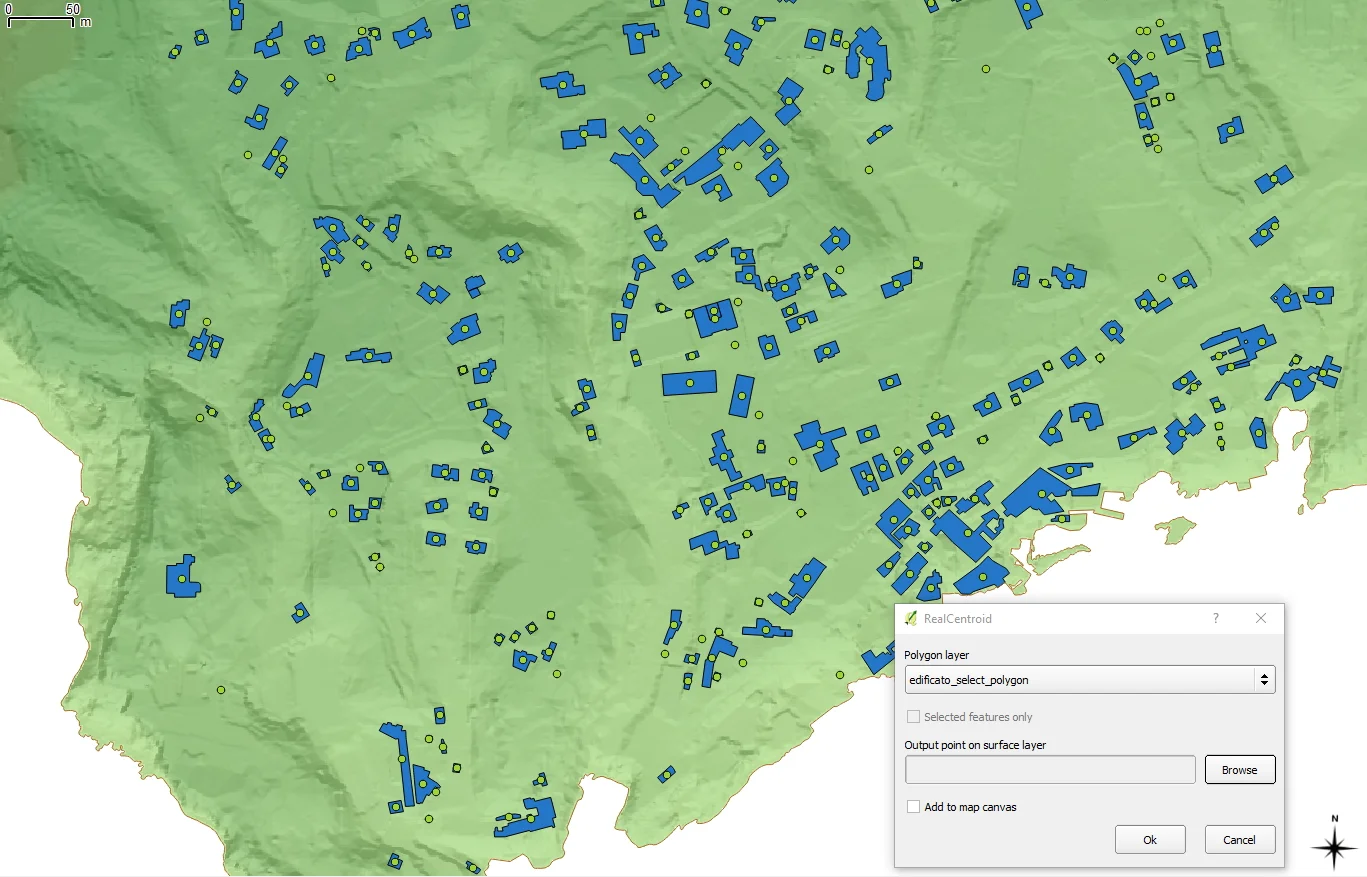
At this point we are going to extract the centroids of the polygons of the building using the realcentroids plugin, then we create a buffer 10cm from the centroids just obtained.
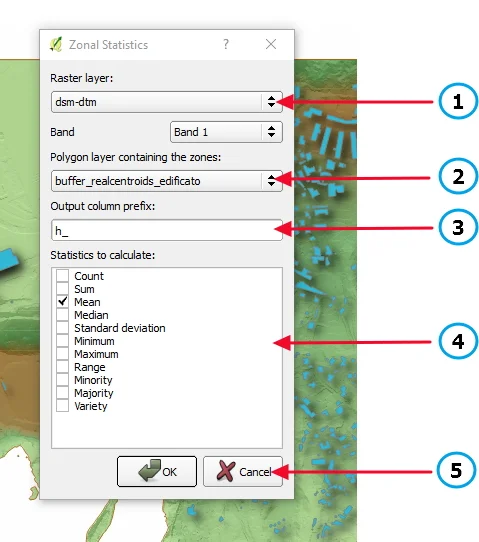
Now with the Zonal Statistic tool we are going to associate the quota, taken from the DEM of difference between DSM and DTM, to the newly created buffer polygon.
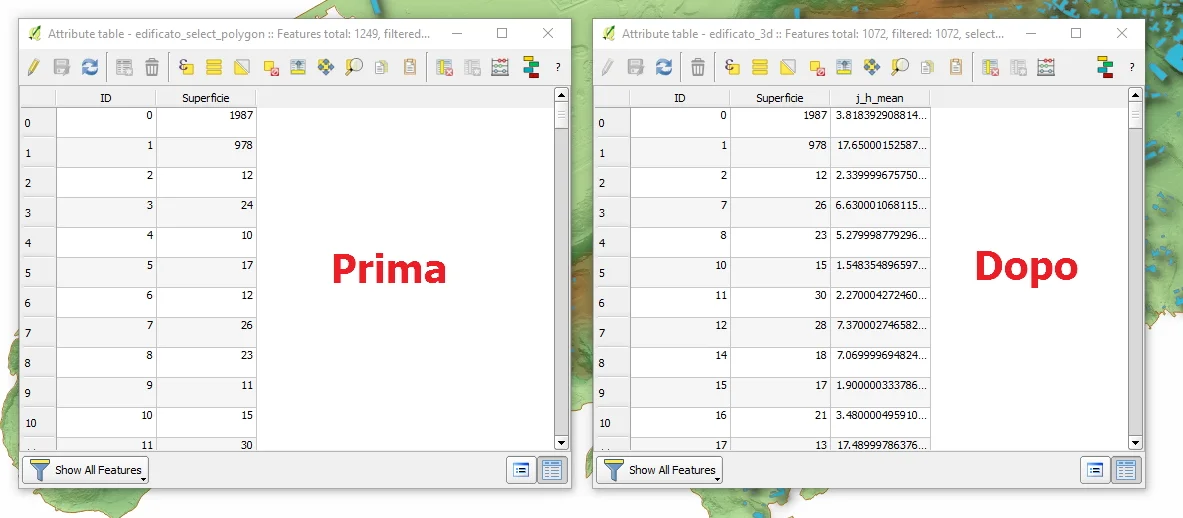
Now with a simple tabular join we associate the elevation field, present in the buffer vector, to the polygonalized building vector and save everything as a new shapefile.
We are finally ready to use Qgis2threejs to create our 3D of the area! If we haven't already done so, let's download the plugin from the repository. So we choose the reference DEM in the DEM section, then we tick the building tab and in Height we choose the field that contains the height of the buildings.
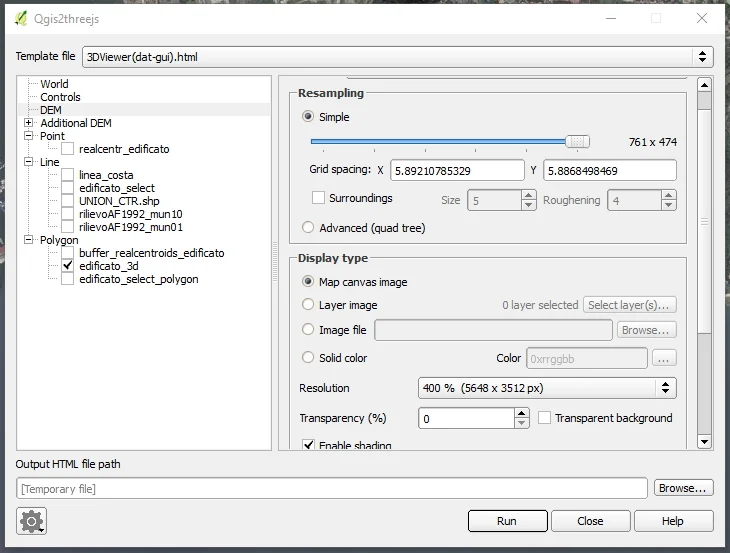
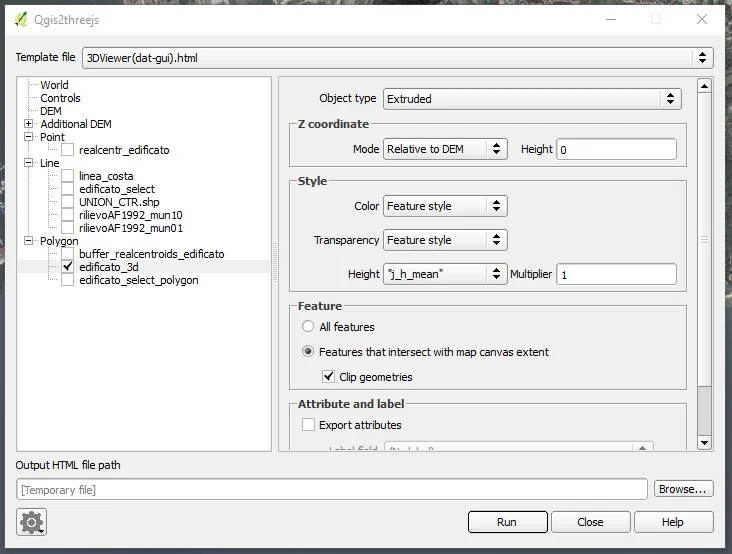
All we have to do is click on Run and the game is over. Done! The result will be an html page that you can upload to a website or have it processed by special 3D graphics software to improve its quality. graphics.
Here is the result of our processing, image and 3D (click on the image to see the 3D!)
